Showing posts with label precious metals. Show all posts

Friday, November 22, 2019

Russia's "Can't Lose" Financial Strategy

17 February 2014 - updated 22 August & 22 December 2014; 30 January 2015; 21 April 2015; 2 January; 20 September 2016; 22 March & 29 July 2018; & 22 November 2019

This is a legacy article, dating back to February 2014. I have been adding updates as they come available. Russian gold reserves have more than doubled since I first published this article, and now stand at fifth in the world

Here's a strategy I've thought about for a while now. This is only possible because we have abandoned the gold standard (and with it, sound money - you can talk to Ben Bernanke, Janet Yellen and Jay Powell about that --- in fact, to any central bank president almost anywhere in the world --- they are all doing the same thing!). 


Let's just say a government decided to print money out of thin air and use it to buy gold. You start with something that is an entirely artificial construct (any national currency in today's world meets this criterion) and use it to buy something that is real, scarce and irreplaceable (gold still meets THOSE criteria!). Voila! You have a "can't-lose" strategy for getting leaps and bounds ahead of everyone else. 

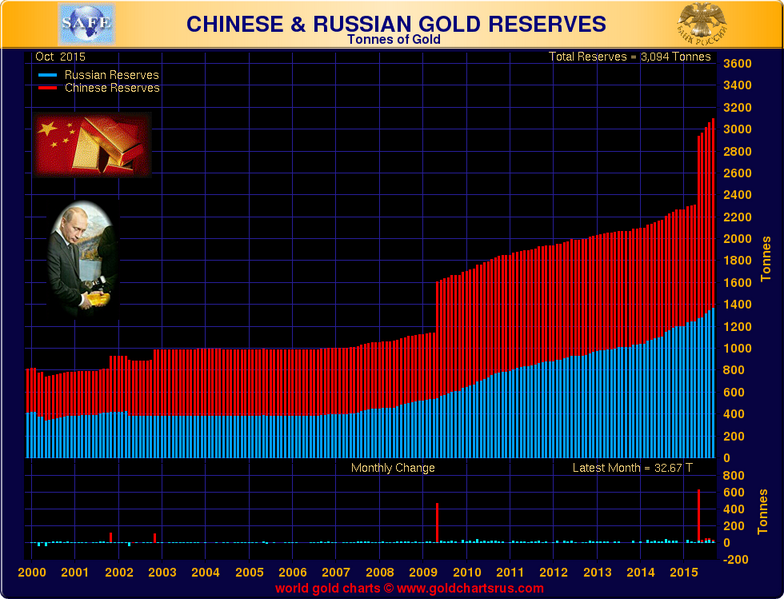
And... at least one country is actually doing this. Check out these two Russian charts.... 


(1) They are buying-up gold hand over fist; and 


(2) They are printing money like crazy out of thin air to pay for it (it's virtually without cost for any nation to increase their "money supply" in the same way, but very few are taking advantage of the continuing --- and surprising --- legality of doing this!). 


Vladimir Putin is a smart guy, period. Perhaps a few of the rest of us should clue in... and catch up. If only individuals were  allowed to  print their own currencies,  as nation-states do! 

Russia's gold reserves were up 150% in 7 years when I first posted this article:


At the same time, Russia's money supply had increased fully by 33% in only 2 years: more than that of the US, Europe, Japan or China at the time. 


Today, in November 2019, Russia's gold holdings are 650% higher than they had been in 2006 (before the bursting of the most recent global financial bubble). 


I had argued at  the time that rather than bailing out Wall Street and the US government, the Federal Reserve should have just put $10,000 in the mailbox of every US citizen (yes, they actually spent more than that much "new" money to rescue the still-staggering US economy and business elites). This would have done MUCH more for the Main Street economy than bailing out BOTH political parties, GM, Countrywide Financial, Bank of America, AIG Insurance and many other monied interests....

But a better scheme even that that would have been to take the $4 trillion new dollars they had printed to bail out the government and the banks after 2008, and to have quietly, discreetly, and persistently bought gold with it. 


Ben Bernanke gave all his money to companies such as Citibank, Fannie Mae, General Motors, and (primarily) the US Treasury, which spent it faster than it came in. It was gone as fast as it was printed, and very little of it actually added to national economic growth.  


By way of contrast, Vlad Putin bought gold with his "printed money." That gold is worth much more now than when he bought it, and, keep in mind, he bought it just by rolling his monetary printing presses! In my world, Mr. Putin is BY FAR the wiser --- and smarter --- man.

_

22 August 2014: While some reports show slow periods and even temporary reversals in Russia's accumulation of gold, the most recent figures from the World Gold Council show that Russia has (again) reported an increase in its official reserves since February 2014, moving its place in global national gold rankings up two additional slots. What can I say? Print money, buy gold. It's legal. Just what I don't really get is why only the Russians are doing it.... (Believe me, some day, this will no longer be allowed!)


Russia (#5 globally):
Official gold holdings:
1,094.7 tonnes

Percent of foreign reserves in gold:
9.7%

Russia has increased its gold holding since February 2014 and has eclipsed both Switzerland and China. In August 2014, Russia's central bank decided to buy up even more gold and diversify away from the dollar and the euro as a result of economic sanctions imposed by the West.

Russia's central bank gold holdings crossed the 1,000-tonne mark for the first time in Q3 2013.

Source: World Gold Council

22 December 2014: While I disagree with Mr. Putin on many points, in particular, the suppression of diversity and political and economic freedom at home, the Russians continue to be cleverer than we in many other respects. Despite rumours that they have been selling gold, in fact, it is US dollars that they have been unloading, while (wisely) buying ever more gold.


For more information, click here.

30 January 2015: Russia's gold purchases were up 123% during the first 11 months of 2014, including the period during which the Ruble began to collapse. The Financial Times reports:

"Russia’s central bank purchased 152 tonnes of gold worth $6.1bn at today’s prices, according to GFMS estimates. Analysts also said Russia’s purchases might have been due to the buying of domestically produced gold that could not be easily sold overseas due to sanctions.

“'This is a clear positive for the gold price,' said Matthew Turner, analyst at Macquarie. 'If central banks had not purchased that gold it would have been bought by private investors or jewellery consumers, and this would likely have required a lower gold price.'

"While Russia was a strong buyer this year, analysts say purchases could slow and the country could become a seller if it continues to liquidate its reserves to support the domestic currency."

For the full story, click here.

21 April 2015: Kitco News reports that Russia has resumed gold buying following a 2-month hiatus (click here):

"After a two-month hiatus the Central Bank of the Russian Federation jump back into the gold market, demonstrating that official demand remains strong, say analysts.

"According to media reports, the Russian central bank bought 28 tonnes of gold in March, the biggest one-month purchase since September. In January the central bank sold 0.5 tonnes of gold and didn’t purchase anything in February.

"The report noted, as of April 1, Russia’s official gold reserves stood at 1,128.3 tonnes, compared to the previous level of 1,207.7 tonnes. According to data from the World Gold Council, Russia has the fifth largest gold reserves in the world (not including reserves held by the International Monetary Fund).

2 January 2016, The world's smartest gold buyers have done it again. As of November 2015, we have these figures:

- Russia adds another 700,000 ounces (22 tonnes) to gold reserves in November
- Russian ally Kazakhstan increased gold reserves for 38th month – 7 Mil ounces
- Russia has added 197.1 tonnes in 2015 – Compared with 172 tonnes in all 2014
- November gold buying is Russia’s ninth straight month of increase
- Russia now has sixth largest gold reserves in the world
- Central bank buys all Russian gold production
- Other Russian gold demand imported
- Russia views gold bullion as “100% guarantee from legal and political risks”

RussiaReservesst20151219

Russia continues to add to its gold reserves and added another 700,000 ounces in November or another 22 metric tonnes, and analysts believe this buying will continue and may intensify in the coming months.
Russian ally Kazakhstan increased its gold reserves for a 38th month to 7.03 million ounces in November from 6.96 million ounces a month earlier.
The latest large increase in Russia’s gold reserves – a “buying spree” as reported on Reuters Africa has again gone largely unnoticed by most analysts. Indeed, the important monetary and geopolitical ramifications continue to be largely ignored in western media.
Russia’s total gold reserves have now increased to 44.8 million ounces or around 1,392.8 metric tonnes (up 40% from February 2014, when this article was originally published), with a current value of just $48.3 billion. Russia’s total FX reserves are $371.2 billion and their gold allocation remains just 13% of their total reserves.
The share of gold in Russian foreign exchange reserves is much lower than in many other countries such as the U.S., Italy and France. Russian diversification into gold is likely to continue and could intensify if relations with the U.S. and NATO powers further deteriorate.
Russia still has less than a fifth of the gold reserves of the U.S. which are believed to be over 8,400 metric tonnes of gold. However, the U.S. has no foreign exchange reserves and is the largest debtor in the world – indeed it is one of the largest debtors the world has ever seen.
Russia now has the sixth highest gold reserves in the world – behind the U.S., Germany, Italy, France and China.
In 2014, Russia bought more gold in than in any year since the break-up of the Soviet Union. The country acquired over 173 metric tonnes according to World Gold Council figures. Reserve diversification intensified after April — averaging about 20 tonnes per month....
Click here for the full story from GoldCore....

Meanwhile, Russian money supply has grown another 7% since the end of 2014, an increase of about 2.2 trillion roubles. 
As I've been commenting, why not print money and buy gold with it? The Russians have got it figured out.... 20 September 2016. The Russians have outdone themselves again. Russia, which has defaulted 5 times and has been in that state for 10 of the last 26 years, just sold a stack of bonds to a collection of hedge funds, pensions and "smart" buyers. Some if not all the proceeds at the government level apparently went to buy yet another 700,000 ounces (21.77 metric tons) of gold in a single month! The Russians are truly unequaled at the level of long-term financial strategy. Click here for more information. 

There is more information here, regarding Russia's fast-rising store of gold. 

Clearly the Russians know something we don't!

22 March 2018. When bars of gold came flying out of a cargo plane taking off from a Siberian airport earlier this month, littering the run-way with precious metal, it was more than symbolic: Russia is hoarding gold, and it’s apparently got so much it can’t keep it contained.

Russia’s been hoarding gold for a while—but it’s going for a new record in 2018, dumping U.S. treasuries for gold at a rate not seen in years as it overtakes China for fifth place among the world’s sovereign holders of the precious metal....
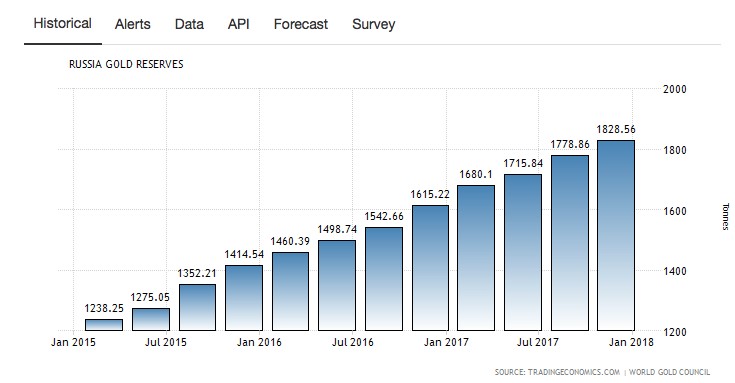


29 July 2018. Russia added 500,000 ounces of gold (15.55174 tons) to reserves in June and bought some 106 tons of gold since the start of the year, with total reserves now approaching the 2,000-metric-ton mark. Last year, Russia added a record 224 tons of gold to the reserves. 

Image result for russian gold holdings chart 2018

Notably, the Bank of Russia has been buying gold every month since March 2015, overtaking China as the fifth-largest sovereign holder of gold. Russia‘s U.S. dollar reserves have also shrunk from $96.1 billion in March to just $14.9 billion in May, according to the Russian Central Bank. Its governor, Elvira Nabiullina, says the decision will help protect the Russian economy and diversify the bank’s reserves.

It's striking that while other central banks have gotten rid of gold and accumulated US dollars, the Russians have been far smarter, getting rid of US dollars and accumulating gold. 


22 November 2019. The Russians are beating the western nations at strategy at every turn. Russia added 9.3 metric tonnes of gold to its official reserve position in October. Gold is now 22% of official reserves. The country's total gold reserve is now 2,252 metric tonnes, much less than the U.S., but twice as much as the U.S. holds on a gold-to-GDP basis. Yes, America holds the world's largest store of gold, but that is because of responsible past leadership. The Russians and the Chinese are living in the present, and alert to what is going on now.


Further to Russia's advantage, the US dollar gold price has doubled since 2006. 


Buy gold for free, and multiply times two! 
_

Thursday, February 21, 2019

Dow Crash Reaches Second Decade - in Gold Terms

21 February 2008, Updated 21 & 23 February 2009 and 21 February 2019

I originally posted this article eleven years ago, on February 21, 2008. It has not been rewritten for contemporary circumstances. Rather, I would like the article to stand as a testament to my 2008 viewpoint on the investment markets. The following text is unedited from 2008:

I am reposting this piece as the theme remains timely. The Dow crash in gold terms will complete its first decade in August of this year. What then? In my view, the second decade of the "real Dow crash" will then begin. Read on for more information. Or, if you recall reading this last year, my updated analysis is at the end of this article. The text below was composed on February 21, 2008:

There has always been speculation as to whether the venerable Dow-Jones Industrial Average will crash in response to one economic event or another. The crisis of the day tends to spark renewed interest in this topic, including various analogies to the great crash of 1929. Of course, today's crisis is the subprime meltdown and the spurious lending and securitization practices that underlie it. Will the present financial and real estate bubble cause the Dow to crash again?


Today's post is intended to keep questions such as this in perspective.

When you measure the Dow in terms of real money (gold), it in fact reached its peak in August 1999, and has declined steadily since that time. In late August 1999, one unit of the Dow Industrials would have cost you 44.84 ounces of gold. That of course would not have been a good buy if you were then a holder of gold (though Gordon Brown, then Chancellor of the Exchequer for Great Britain, was selling the last of the mighty empire's great store of gold at bargain basement prices at that time; in fact, Mr. Brown sold 60% of Britain's gold at a lowly $275 per ounce between 1999-2002, one of the worst acts of market timing by a government official in recorded history - and government officials are rarely noted for their economic acumen - Ronald Reagan and Margaret Thatcher partially excepted!).

If you had held onto your gold in 1999, and waited until today to buy the Dow, you could have had it more cheaply. At today's prices, roughly 13 ounces of gold will now buy you a unit of the Dow. That is, you get a single Dow unit for 32 fewer ounces of gold, which remains a timeless currency with relatively stable purchasing power. Let's round that off, and call it a 70% discount.

Or, alternatively, let's just say that the crash of the Dow is now in its 9th year, and that it has so far fallen 70% while facing into the headwinds of the mega-inflationary 21st century.

Is the Dow done falling, now that the Dow-to-gold ratio stands at 1:13 vs. almost 1:45 only 8-1/2 short years ago?

Not according to those who engage in long-term analysis.

In fact, the Dow has tended to bottom against the price of gold at roughly a one-to-one ratio every 40-50 years. As Eric Hommelberg's 2005 chart of the Dow-to-Gold ratio shows, you could last have bought a unit of the Dow for the cost of about one ounce of gold in 1980 (when an ounce of gold at $887.50 per ounce was almost as valuable in (nominal) dollar terms as it is today (gold presently stands at about $950 per ounce). Mr. Hommelberg was conservative in 2005, speculating that the Dow might fall to the value of as many as 5 ounces of gold. Three years later, Mr. Hommelberg's projection now appears quite modest.

What are the implications?

If you are more patient (and prescient) than Gordon Brown, and hold onto your gold a bit longer, perhaps another 10-20 years, the chances are that you will be able to buy one unit of the mighty Dow-Jones Industrial Average for a single ounce of gold - possibly less, approximately a 98% discount to the deal that Gordon Brown got for the British government, beginning at the Dow's gold peak in 1999.

Is the Dow, therefore, going to crash again?

I hope you can see now that this is the wrong question.

It already has.

The Dow has so far fallen 70% against the price of gold in the 8-1/2 years since the Dow's August 1999 peak in gold terms, and it is presently just in its next leg down, as today's charts make abundantly clear. (Click here for a current analysis by Captain Hook.)

Chances are, the Dow has another 28% to go before it's done - when a single unit of the Dow-Jones Industrial Average will be of the same value as a single ounce of gold. At that time, the Dow will have collapsed 98% against the price of gold.

I guess you could call that a Dow crash.

21 & 23 February 2009:

Since posting this article one year ago, at which time 13 ounces of gold were required to buy the
Dow-Jones Industrial Average, the trends I identified have if anything accelerated.

In a short year, you now get almost "twice the Dow" for your amount of gold, as the Dow has fallen almost another 50% in gold terms over the past 12 months. 7 ounces of gold will presently buy you the
Dow-Jones Industrial Average, as compared to 44.84 ounces of gold in August 1999, or 13 ounces of gold in February 2008. That is, the Dow:Gold ratio has now slipped by 84%.Want my advice?The Dow is still no bargain. Don't cash in that 7 ounces of gold for the Dow, but hold onto your gold - for further long-term appreciation. This trend has years to run, as the "real Dow crash" completes its first decade. As of August this year, the Dow crash against gold will enter its second decade, and the crash - or collapse, if you prefer - will simply continue.

Gold has much further to rise, and the Dow much further to fall. A unit of the Dow for 7 ounces of gold remains no more a bargain than when 45 - or 13 - ounces of gold were required to purchase the Dow in 1999 or 2008!
Let me emphasize that I am not predicting short-term trends here. The Dow might rise for several months, and gold could fall for several months. I believe short-term market prediction is essentially impossible. But why take the chance? The trend is clear. If you did not exit mainstream equities in 1999, or even in 2008, you can still get out now.

Gold - though volatile in price on a short-term basis - remains a safe and comfortable companion in uncertain economic times. And in our present case - where is the uncertainty? We know that the foundations of the economy are at their most unstable in almost a century - and, as a consequence of leverage and other forms of financial gymnastics - perhaps at their most unstable in all of human history. Gold is the obvious choice in such circumstances.

(See also these related posts, comparing the Dow to the AMEX Gold Bugs (HUI) Index, and exploring the issue of "financial disasters.")


UPDATE FEBRUARY 21, 2019: Here's how the Dow looks in nominal (non-inflation-adjusted) terms. It seems to be doing well, particularly since 2009. However, appearances can be and frequently are deceiving, especially in the investment markets. 


By way of contrast, in gold terms, the Dow Jones Industrial Average has lost 57% of its value since 1999, and that is not adjusted for inflation, which has been quite considerable over the past 20 years, and more than the government is willing to tell you. Using official numbers, you must subtract an additional 34% from your adjusted 1999 investment amount (43% remaining, minus 34% inflation, leaving only 28% of your original investment intact). This calculation yields a (marginal) inflation-adjusted 20-year loss of 72% in gold terms.

Once you take out the inflation, there is just about nothing left, except you do get to keep your dividends. To be clear, dividends are nice to have, but when you have lost 72% of your principle, the dividend is best attributed to "return" of principle (I would say "destruction" of principle). 

Keep in mind that inflation is much higher than the government reports. A rough estimate is that very likely 90% of your principle is already gone, 20 years later (when contrasted to a scenario in which you had purchased gold with your investment funds, rather than the Dow). 


Further, after falling from 2011 to 2015 in US dollar terms, gold has renewed its uptrend since December 2015 (so far modestly, though definitively). Gold's greater than 3-year renewed uptrend implies a return to a downtrend in the Dow on the Dow:Gold ratio chart, quite likely very soon. 


You'll recall that 44 ounces of gold were required to buy the Dow in 1999. That number fell to 13 ounces in 2008. While the Dow has obviously recovered considerably, and is currently at new (all-time record) nominal highs, you can still purchase the Dow for only 19 ounces of gold, yielding the 57% cost saving we discussed earlier. 


Are we again approaching a time when you can buy the Dow for only 1-5 ounces of gold? As we saw above, that happened in the 1930s, and again in the 1970s (and came as close as 7 ounces of gold in 2009). Cycles tend to repeat, and it's virtually certain that this will happen again.

My advice: If you haven't done so already, get out of the stock market now, while your savings are still intact, and maintain a substantial portion of your savings in the precious metal sector (the percentage is up to you, though the standard recommendation of "10%" is insufficient for current circumstances --- I suggest 50% or more as a proportion appropriate to today's highly dangerous bubble conditions in all asset markets). 

And: Click here for a great discussion of this topic: Dow Gold Ratio: How Does Gold Compare to Shares For the Past 100 Years?

_

Monday, February 13, 2017

It's Gold's Turn in the Waltz....

13 February 2017 - charts updated 13 July 2017

The ups and downs have been harrowing. There is no other word for it. While the S&P 500 has easily outperformed gold since 2011, the two have been at a draw since December 2015, and gold has more than doubled the SPX (S&P 500 broad US stock index) since 2001 (when the collapse of the tech bubble triggered a renewed search for value and wealth preservation). Further, at least this is my view, stocks are inherently risky in an uncertain world, whereas gold is not --- particularly if you have a longer time horizon. As for the direction from here, I think there is no question that gold will outperform over the next 1-5 years, perhaps dramatically. It's how the two of them dance, and at this point in the exchange, it's gold's turn to shine more brightly still. It's a little bit of a waltz, but there are crescendos................


Just to put it all in perspective, we know in retrospect that the gain in the S&P 500 from 2002-2007 was entirely a bubble (as was the 90s dust-up before that). How moderate does that now appear, in contrast to the Himalayan ascent from 2009 to now? I'm a little at a loss as to how to describe it... The S&P trades at 26x earnings in an era of virtually zero growth. I've seen it called the "everything" bubble. It is fuelled by mad moneyprinting and/or so-called "accommodative" policy (loaning money at near or below-zero rates) in virtually every corner of the world. How can that possibly end well?


As you can see, gold got a little ahead of itself in 2011, and took a breather from Sep 2011 through Dec 2015 (51 months). Gold is now running sprints again, and training for the next marathon. It is the favourite to win.


Keep in mind, the first chart presented shows the gold price divided by the price level of the S&P 500 index. You may or may not recall the fireworks, which were mostly set off between 2007 and 2011. As of right now, another launch is being prepared, and based on the intelligence I receive, this one may actually prove to be another lunar mission (along the lines of 1976-1980, but longer, stronger, higher and more enduring).

We are preparing now for blastoff of the second and stronger stage, possibly as soon as the second half of 2017. 

Image result for moonshot
_

Thursday, October 27, 2016

Something Happened in 2001 --- and Nothing Shows It More Clearly Than the Gold Price

27 October 2016

Gold attained its intraday high price of $887.50 USD per troy ounce in early 1980, after climbing from its (fixed) 1934-1968 level of $35 in a steady and exponential march. From 1980 - 2001, the gold price didn't really do much, except mostly fall. I hope that even to the naive observer, however, it is evident that something changed in 2001 --- and that was central bank experimentation with money printing and ultralow interest rates that is unprecedented in all of human history (combined with a series of out and out crashes --- not yet done --- that have wracked the inflated markets and made mainstream investors increasingly insecure). 


After peaking in September 2011, the gold price fell until December 2015 --- and this occurred because market participants believed the moneyprinting and low/negative rates were working to boost the economy. 

What is now becoming apparent is that moneyprinting and low rates actually create a trickle-up economy, in which funds flow to those who can afford to borrow and leverage up at low rates and speculate. Investment in truly productive projects has remained neglected --- almost stagnant --- while speculators occupy themselves with paper gains, stock buybacks, leveraged buyouts encumbered with unpayable debt, showpiece projects (Trump Towers, anyone?) and other unproductive or even destructive misallocations of capital. 

Live 24 hour Gold Chart

This post is just meant to be a heads-up. The moneyprinting and free money don't actually make the economy grow... they just take it off-track in unproductive dead-ends. If I'm right, then, from here, gold is headed much, much higher than its 2011 peak of $1934 USD. Decide for yourself. I've made my decision....
_

Monday, January 12, 2015

Fed Bubble #3 Will Hit Canada Harder Than Bubbles #1 and #2


22 & 23 December 2014, 12 & 13 January 2015

This post refers to a well-researched article published yesterday by Sober LookIf energy prices remain near current levels, Canada's economy is in trouble.


Collapsing energy prices will be the story of the year for Canada, due to our high costs of production in the oil sands sector. In the US, the primary impact of low oil prices will be on the over-leveraged, capital-intensive and high-turnover shale fracking sector. In Canada, the oil sands operations are much better-funded, but they're not economic at these prices, and we have fracking going on here, too. 


But the real Canadian story is that we have so far entirely missed the US real estate correction (due to riding the commodity boom), but the turndown in oil prices is going to hit Canada's real estate market very hard. 

While our energy sector is much less leveraged than in the US, our housing sector is clearly vulnerable. Our household debt load has doubled as a percentage of income since 1990. 


Canadians are now also borrowing more than Americans, which would not be a good sign at the best of times:


The collapsing oil price is thus emerging as Canada's biggest economic setback in decades (and the natural gas business is no better).


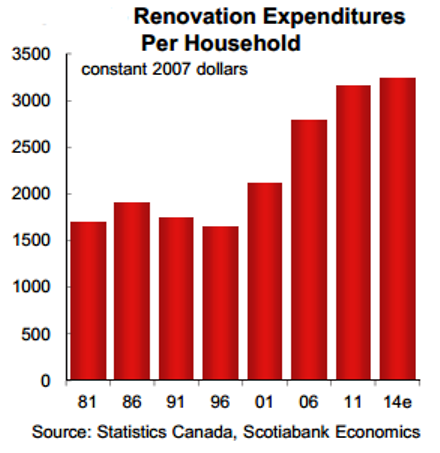
By the way, one statistic really caught my eye. I have been commenting for as long as I can remember that we keep our local construction workers busy full-time without building any new houses. In fact, I have been on the mark. Canada has been involved in a renovation boom for years (see story and chart). Falling energy prices will impact that, too, and it's likely that real estate prices have already peaked, given how fast the rig count is dropping in the oil patch. 


Now... will this be the crisis that triggers a resurgence in gold? Well, Mr. al-Naimi just announced that the Saudis don't care if oil falls to $20/barrel. They are obviously wishing to preserve market share, and they are fighting a battle they can win. 

Note that the Asians have been playing years ahead of us in stockpiling gold, as a hedge against bad debt and economic volatility. This trend has not reversed since 2011, when the chart below was created. 


Despite being embroiled in their own crisis situation, the Russians haven't stopped buying gold either. 


In fact, they are selling US dollars to enable their gold purchases (I would, too). 


The gold price will be leveraged if there is a credit crunch, and that appears to be what is shaping up. Once again, the crazy Americans have started another boom/bubble with the only real economic and employment growth of the past 7 years having occurred in only 5 shale fracking states. (A map of US shale-energy sites is presented below.)


And of course, everybody will pay for the Federal Reserve's latest experiment in bubble-blowing. 


What is the moral of this story? You can't print $4 trillion of funny money and not have consequences. The Fed brought on the so-called Great Recession in 2008 --- arguably a depression, which has so far been masked by moneyprinting and borrowing, but it has not gone away. 

The chart below shows that the Federal Reserve has recently accumulated $4 trillion in assets, purchased with printed money, that it cannot sell without creating irreparable market dislocations.


Booms are not the same thing as economic growth. Rather, they are temporary and unsustainable events caused by economic central planners who believe that moneyprinting stimulates the economy. However, moneyprinting always results in malinvestment, which results in transient booms that ALWAYS go bust with real capital loss. 


Only saving, combined with capital investment for the long-term, produces growth, whereas stimulating borrowing and debt (the strategy used by economic central planners since 1987) always fails. 

As evidence of the current "boom" dynamics, Peter Schiff points out that the number of energy workers in the US has doubled in the past decade.... Let's call this the "stealth bubble," because most of us don't see its direct evidence. Mr. Schiff believes that other bubbles will be unmasked by the collapse of the US energy bubble: Could An Energy Bust Trigger QE4?

In the chart below, we see how decades of Federal Reserve bubble-blowing has decimated US breadwinner jobs.


If you want to know more about how Fed bubble #3 is unfolding (with the usual dire consequences), David Stockman has summarized it here: The Fracturing Energy Bubble Is the New Housing Crash

Here, we see that Federal reserve intervention has added to jobs only in the least stable and lowest wage sectors.


And for a little more digging into risky energy finance, have a look at John Mauldin's recent review, here (though I disagree with his speculation that we've outgrown our need for jobs --- rather, Fed-induced malinvestment keeps killing them): Oil, Employment, and Growth

Combined with the above charts, it is evident that the latest boom has led to the creation of only low wage jobs (above) and speculatively-financed carbon energy sector jobs in only 5 states (below).


It's also worth noting that there is presently $173 billion in US energy junk ("high yield") debt presently outstanding, and that it is dragging other debt markets down with it. This is the part of retrenchment with the greatest implications for the economy as a whole. Read more here: U.S. shale junk debt tumbles amid oil crunch.


As would be expected, the Canadian energy sector is under severe pressure as well, as summarized here: Canadian energy firms hit the alarm bells.

The article linked at the start of this post is brief, full of charts, easy to read, and sobering. If I'm right, the energy sector will remain weak until the vulnerable players get taken out of the game. It is bad debt that will eventually force interest rates higher, whether our central planners wish for rates to go that way or not. 

On the upside for Canada, which has more mining companies than all other countries in the world combined, the fallout in bad debt from the collapse in the carbon energy sector could be counterbalanced to some degree by a resurgence in the gold mining sector, which will certainly benefit the region where I live (Northwest Ontario). 


Keep watching, and look out! The oil price collapse seems quickly to be unmasking Fed bubble #3, as far as I can tell from here. 

When do the bubbles and booms stop? When the central planners stop intervening by printing money and "stimulating" borrowing and debt in the absence of viable targets for investment. 

Where should the investment be coming from? 

Savings, not borrowing. 

What should we be investing in, instead of booms and bubbles?

Let the market decide --- without intervention by central planners.

--------------------------------------------------------------------------------------

23 December 2014: Here are some US oil statistics from Wikipedia. 

Oil products constitute 7.6% of exports and 14% of imports. The U.S. is the world's largest producer of oil and natural gas. It is the second-largest trading nation in the world as well as the world's second largest manufacturer, representing a fifth of the global manufacturing output. 

The United States is the second largest energy consumer in total use. The U.S. ranks seventh in energy consumption per-capita after Canada and a number of other countries. The majority of this energy is derived from fossil fuels: in 2005, it was estimated that 40% of the nation's energy came from petroleum, 23% from coal, and 23% from natural gas. Nuclear power supplied 8.4% and renewable energy supplied 6.8%, which was mainly from hydroelectric dams although other renewables are included.

American dependence on oil imports grew from 24% in 1970 to 65% by the end of 2005. Transportation has the highest consumption rates, accounting for approximately 68.9% of the oil used in the United States in 2006, and 55% of oil use worldwide as documented in the Hirsch report.

In 2013, the United States imported 2,808 million barrels of crude oil, compared to 3,377 million barrels in 2010. While the U.S. is the largest importer of fuel, the Wall Street Journal reported in 2011 that the country was about to become a net fuel exporter for the first time in 62 years. The paper reported expectations that this would continue until 2020. In fact, petroleum was the major export from the country by 2011.

For some Canadian petroleum statistics, please click here

12-13 January 2015: Arthur Berman offers an insider's view on the economics of shale oil. He clarifies that the real breakeven cost in shale oil is $85, and that a $90 crude oil price is needed to make shale investable. A very strong argument can be made that shale investment "happened too soon" due to central bank intervention and bubble creation. Mr. Berman's article is here


Mohamed El-Erian explains why "this time is different" here. To be honest, central bank intervention always makes everything different... and worse. Remember: a boom is not growth. It's that simple. Booms are driven by debt and speculation, whereas growth is driven by redeployment of savings and long-term consideration of investment returns under all circumstances.

Jeff Gundlach reiterates the warning hereGundlach, who correctly predicted government bond yields would plunge in 2014, said on his annual outlook webcast that 35 percent of Standard & Poor's capital expenditures comes from the energy sector and if oil remains around the $45-plus level or drops further, growth in capital expenditures could likely "fall to zero." Gundlach, the co-founder of Los Angeles-based DoubleLine, which oversees $64 billion in assets, noted that "all of the job growth in the (economic) recovery can be attributed to the shale renaissance." He added that if low oil prices remain, the U.S. could see a wave of bankruptcies from some leveraged energy companies.
_