Tuesday, March 08, 2011

Sure the Market's Rational - Just Give It Two Decades!

8, 21 & 27 March 2011

In Canada, gold stocks have been lagging the price of gold from the start of the gold bull market in 2002 (they were quite lively in later 2003, from May 2005 - May 2006, and of course after the October 2008 crash, but that's about it!).

Of course, the Canadian dollar has run up from $0.62 US to $1.03 US during that same period (a trend that will continue for most of this decade). That is a 66% gain - no small headwind against the US dollar gold price! (Unfortunately, I can't chart the SPTGD Canadian Gold Miners Index against Canadian dollar gold, or I would!)

However, even when we look at gold mining stocks in US dollar terms, we still see a decline in the ratio of the stock prices of gold miners (the HUI "Gold Bugs" index) to the price of gold from 2003 onward.
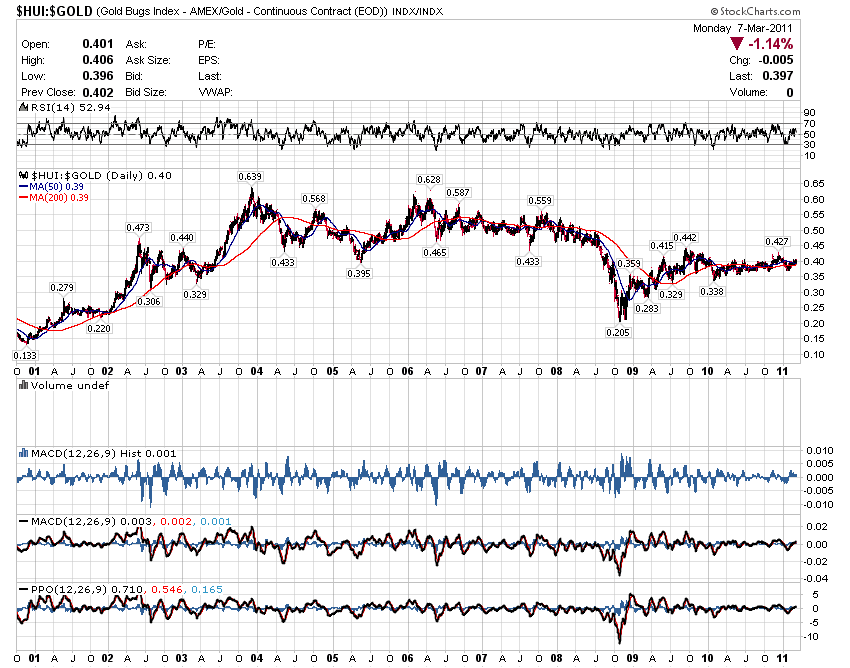
What's wrong with this "ratio" decline? I can tell you - gold miners' profits are rising faster than their costs, due to the now 10-year long gold bull market - but the miners are losing in value against gold, whereas rationality tells us that they should be gaining as their margins inexorably rise!

Consider too that gold has been quite strong - more than sufficient to cover rising costs - in Canadian dollar terms as well, as seen below (Canadian dollar gold had risen from $390 to $1405 as of March 7, 2011):

Is the market therefore irrational?

My gut response is to say, "Yes, absolutely - this downtrend in gold mining stocks relative to gold is totally crazy!"

However, as we have discussed here many times, this is just the "wall of worry" that all bull markets climb. In fact, I'll tell you exactly what is happening. Gold has been gaining in price for 10 years - and it has at least 7-9 (and perhaps many more) years to go.

However, every time gold makes a new high, the broad majority of investors start to prepare for the possibility that "the top is in." Then when gold sells off even $10-$20, due to normal market fluctuations, they unload the gold stocks they had bought a few days or weeks earlier. On a daily or weekly basis, this pattern of fluctuation looks like noise, but as you can see on the long-term charts above, the market is now dramatically underpricing the stocks of global gold mining companies (60% of all mining companies are listed on the Canadian exchanges).

That is, everybody knows this is a 10-year bull market, but the great majority entirely lack confidence that it will be an 11-year or 12-year bull market, let alone a 17 to 18-year bull market (which is typical of such cycles), or perhaps a 2 to 3-decade bull market, as we have seen recently in bonds - which surely are topping out somewhere about now.

Take today's action as another example of that consistent pattern. Only yesterday, gold made a new all-time record high of $1444.40. However, today it sold down to as low as $1423.40 (a $21 decline, but from a record high level!).

What then happened to the gold stock sector? Let this come as no surprise to you - gold stocks were smashed, with both the HUI and SPTGD gold stock indices losing over 1%. Hey, and what happened yesterday? Oh, the same thing. On that day, gold sold at the highest nominal US dollar price it has ever commanded in history - and the stock prices of gold mining companies sustained losses of about 1.5% on both the US and Canadian exchanges - greater than their losses today!

Again, on a daily basis, this looks like noise. but it actually represents a cumulative 9-year downtrend in the market price of gold mining companies relative to the soaring price of the commodity they sell at ever-increasing profits - gold!

If the market is indeed irrational, as demonstrated above, will it then correct at some point for such obvious mispricing of gold mining companies?

You betcha!

If history is any guide, the odds are 99.99% that the answer is "yes." At some point, the market will price gold stocks rationally - and then, more confoundingly still - it will go on to over-value them!


So what am I claiming here?

Basically, I am stating that markets are in fact 100% rational - just not in terms of their daily behaviour, which over time may accumulate to periods of years and - as we see in the present example - decades!

What then are the lessons?

Pretty simple, actually.

Investors who hold on to gold mining stocks at today's prices will virtually certainly see fabulous gains at some future point, probably still several years in the future, as gold stocks move from being undervalued to being rationally valued, and then to being overvalued.

Sounds crazy?

Hey, this is human nature we are discussing - cumulative human psychology if you will! This is just what humans do. All the charts are doing is reflecting our own behaviour back to us - bizarre though it may be!

Based on historical trends, gold stocks are likely to be fairly valued (again) a few more years forward - perhaps as soon as 2012, based on multi-decade patterns of strength and weakness in this particular sector, which have been identified by Pamela and Mary Ann Aden.

Then what? Well, a few years further out, the market will over-value gold stocks, and then it will be time to sell them - but by my reckoning, that period of over-valuation will not occur until near the end of the present decade - or perhaps even later.

In fact, the consistently negative relative price action of the past decade has been very bullish for gold stocks!

Why is that?

Basically, contrarian psychology is at work here. After ten years, it should be quite obvious to essentially everyone who is paying attention that gold is in a sustained bull market.

As obvious as this sounds, the great majority of investors do not yet perceive this. They view the entire period to date as an anomaly - a mysterious or irrational trend that at any moment is likely to reverse.

After 10 years, you might think that such twisted logic would no longer be persuasive. Yet one need study the price action in gold and gold stocks over only the past two days to see that the same pattern which has kept gold stocks undervalued for a decade is persisting at this very moment!

Here's the funny thing about markets though - and all investors who have studied history know this - the present pattern of pricing gold stocks will not end until it has turned around to its opposite.

That is, to anyone with historical awareness, the recent top in the gold price ($1444.40) cannot possibly be the top price in the present trend, because the market is still undervaluing - vs. overvaluing - gold mining companies.

Historically - these two patterns have never occurred at the same time. That is, the gold market can "top out" only when gold mining stocks have become overvalued. There is no precedent for such an occurrence at a time when mining stocks are under-priced relative to gold, particularly while still in a 9-year relative downtrend!

Again, reversals at junctures such as we see at present simply do not happen - ever!


(To be clear, I'm not saying that we will necessarily ever recapture the ratio highs of 2002-2003 - or that gold mining shares can't randomly fall quite a bit below where they are priced today. Rather, I am discussing larger patterns. What I maintain is that the bull market in gold stocks can end only when gold stocks are over-valued, that is, when they are in a sustained uptrend relative to the price of gold. Such ending patterns have no resemblance whatsoever to the pattern we have witnessed for the past 9 years!)

History teaches an incontrovertible lesson. No sectoral bull market has ever ended with stock prices at undervalued levels. All bull markets end in overvaluation - every one, every time! And again, if history is our guide, no commodity has ever advanced for ten years and then reversed while the shares of companies that produce the commodity were lagging in price. This just plain does not occur - ever!

Now, that is about as close to a golden guarantee as you are ever going to get that the present bull market in gold has years to go, even if on many days gold stocks fall off a cliff when we see price declines in gold itself of $10-$20 or more - even when those declines follow record highs!

As has been said, "Don't sweat the small stuff - and it's all small stuff!"

What's the big picture here?

This is a bull market in gold, and at some point mainstream investors will wake up to this fact and drive the prices of gold stocks much higher than they are today.

And, if you're holding gold stocks already?

Just relax and take the ride.

It may be bumpy, but the ultimate direction is always up in markets of this type.

It is your golden guarantee!

21 March 2011: For your edification, I am posting below the most subtle chart of a rising trend that I have EVER seen:

The above chart is of the ratio of the "HUI" gold stock index to the price of gold. Now, look at the four "bottom" points on the chart starting on August 4, 2010. Now, do the math to a few decimal places. That's right!. Taking the last four bottom points into consideration, gold stocks are now rising against the price of gold - with the differential across the four bottom points amounting to a cumulative gain of .0034!

That, my friends, is perhaps the most subtle rising trend you will ever witness in a lifetime, but - and this is very important - the direction is up!

Savour it, gold investors! This is good.... you may never see anything like this again!

For the doubters in the crowd, here is the same chart from January 2010 through the present:

Yes, indeed. It's an uptrend... still!

27 March 2011:

Ho hum.... Gold set another record high this week.


The consequences? Well, things were going great until a new all-time record-high gold price was set at $1447.30 on Thursday. Then all hell broke loose!

Gold sold off and gold stocks sold off on Thursday and Friday both (though it was otherwise a net positive week for both gold and gold mining stocks).

Here is the 5-day gold chart:

And the 5-day chart of the HUI "basket of unhedged gold stocks":

Yep. There is nothing worse than record high gold prices for the gold stocks - or even for gold itself!

And yes, the psychology will change at some point. But don't hold your breath!
_

Sunday, February 27, 2011

Buy Goldcorp Now

27 February 2011

Here is perhaps the most important chart for Goldcorp:

Goldcorp has been declining against gold since May 2006 (see chart).

Goldcorp has just released a blow-out report. It is now performing better than ever, with increased production, increased reserves, new mines opening, an increased dividend, ballooning profits, etc.

I submit that the reversal of this almost 5-year downtrend (the ratio of Goldcorp's price to the price of gold) may have started in January 2011. If this is the case, Goldcorp's upside (from a ratio low of .0293 in January 2011) could be a recapture of the .05 level - even higher.

Let's say that gold is at $2000 by the time Goldcorp retakes the .05 ratio. This would put Goldcorp's share price at $100 (from today's $46.00).


Now I'm speculating. If we see $2000 gold in 2012, that means that Goldcorp could gain 100-150% by some time next year.

Short-term moves are hard to predict. but my intermediate target for Goldcorp is now $100.

Buy Goldcorp.

1 March 2011: FYI, the Gold Stock Analyst has just raised his long-term target for Goldcorp, based on the recent news. I recommend that you subscribe. Click here!
_

Wednesday, February 16, 2011

Financial Disaster Update

16 February 2011

I have blogged previously on the topic of impending financial disaster. Hey - you don't have to be a genius to see it coming!

A toxic mix of excess liquidity (money printing) and capital misallocation (new investment flows directed towards assets of declining value such as uncompetitive automakers and residential real estate) has resulted in falling employment, declining tax revenues, and skyrocketing consumer and government borrowing. Inflation in consumer prices is now wending its way into the mix. Both government officials and Federal Reserve Board members believe that we can spend our way to prosperity. Wait a minute! Don't you increase wealth by saving, not by spending?!?!?

For those perhaps new to the topic, here is a link to a concise Business Insider article offering a quick overview of the fundamentals of financial disaster (US style): "10 Charts That Embody Everything That's Wrong With the U.S. Economy."

I wish it weren't true, but this is what is happening, and the people in charge are trying to fix it by borrowing and spending more. You don't need a degree in economics to know that an approach of this kind is doomed to catastrophic failure!

As to the topic of inflation - don't believe the totally made up government figures of 1-3 percent per year. The chart below tells it like it is (based on
the way inflation was calculated in the "olden days" of 1990):

As you can see, real inflation (according to Shadowstats) has been running at about 10% per year since 2000, and it began travelling above 5% as early as1987. That is a lot of currency devaluation, and has much to do with explaining the decade-long rise in the gold price....

What has saved the US in the face of such a disastrous inflationary policy? Well, so far, everybody else is inflating their currencies too.

The problem? It's just that the US owes more in debt payments ($50.7 trillion in 2009 and rising at about $2 trillion/year) than all the other countries of the world put together (total world debt is about $100 trillion).

Now that is a hard problem to solve!

17 February 2011: This embedded video is not the scenario I most expect for how the US dollar collapse will play out, but it does serve as a reminder that gradual changes can lead to sudden changes.


Presented by the National Inflation Association, an organization which anticipates hyperinflation. In my view, other things will more likely happen first. But it could happen as this video predicts. Something to think about....

Click here if the video doesn't work.
_

Saturday, January 29, 2011

Today's Thoughts on Gold

29 January 2011

These comments were in response to an article on seeking alpha, to which I responded today.

If gold does peak out here, it will be the first time it has done so in the past decade without a spike preceding the correction. The gold move has been very moderate relative to the 200-day moving average.

(Chart courtesy of Adam Hamilton at Zeal Research)

Also, the major gold stocks are trading as though the gold price hasn't moved yet. Apart from 2008, that is also unusual. That is, gold stocks (the HUI) are somewhat below their early 2008 peak (now 3 years ago), but gold is $300-400 higher than it was then. So if $1000 gold warrants a 500 HUI, then what about $1400, 1300, even 1200 gold? I'm not saying gold can't go lower or trend sideways. It's the elephant in the room and can do whatever it wants. But this is an unusually weak top for gold if that's what it is, and the gold stocks are showing typical bottoming behaviour, not topping behaviour.

(Chart courtesy of Adam Hamilton at Zeal Research)

I have always maintained that gold will do what it wants, regardless of what you, I or anyone else believes. It has both punished and rewarded me by doing its own thing. The only fact I know with certainty is that just holding on to gold has led to better days for the patient investor since 2001.

So why trade it when you can just hold it?
_

Thursday, January 20, 2011

If I Were a Hedge Fund Manager, I'd Buy Goldcorp - the Whole Company, That Is!

20 January 2011

This is getting ridiculous. The price of gold has almost tripled since this time 5 years ago (you could buy gold for about $500 US in January 2006).

Now let's look at the world's fastest growing major gold mining company....

No secret, Goldcorp is making out like a bandit. With production costs below $300 per ounce, the profit margin on each ounce of gold sold is up on the order of 500% over the past 5 years. Further, Goldcorp is now producing far more gold each year, and will continue to do so for as far as the eye can see. This is not true with such respected major gold mining companies as Newmont Mining, Barrick Gold or Gold Fields, for example.

So where is Goldcorp's (Canadian dollar) stock price? How about below its May 2006 level? That's right. You heard it here first! You would have paid $45 for a share of Goldcorp in May 2006, at which time gold had moved higher, to a point where it was briefly over $600 per ounce (about half today's price of $1345.70.

What does a share of Goldcorp set you back now? If you were on the ball, you could have picked it up today for $39.84.

So to recap (over the past 5 years): Goldcorp's gold production is up massively. Margins are up something like 500%. And the stock price is down somewhat more than10%.

Does this make sense to you?

It certainly doesn't to me.

If you had told me these facts 5 years ago, I would have told you that this would not be possible. But here it is. On a golden platter, if you will....

Of course, markets can be irrational any time they want, as often as they want, and for as long as they want. But Goldcorp is sure one heck of a screaming value at $40 per share in January 2011. At this price, I'd be willing to put 100% of my portfolio in the company, and I would sleep like a baby (Goldcorp does happen to be one of my largest stock positions).

Now I am not complaining. It's none of my business what the market does. I'm just a shareholder looking at fundamental value.

But if I were a hedge fund manager with a few billion dollars in my back pocket? Heck, I'd just go and buy the whole company, close my hedge fund, retire, and live off the cash flow for the rest of my life! No matter how long I lived, Goldcorp would take care of me virtually forever.

Note: $29.7 billion (CDN) would buy all of Goldcorp today. Annual revenues at $1400 gold? This year's 2.3 million ounces of production will amount to $3.2 billion before expenses, which are somewhat below $700 million. You've got it. the profit margin is on the order of 78%.

Good business?

It's a gold mine.

Future prospects?

Again, Goldcorp is the fastest growing major gold miner in the world.

The gold price?

Likely to be over $2000 in a couple of years, which, with production growth, will bring total annual revenues well over $5 billion. You could be looking at $6 billion per year in 2 years. (These are all back of the envelope calculations.)

If I were a hedge fund manager, looks to me like I'd get my money back in about 6 years, maybe 5. (Perhaps 8 years if things don't go my way.) After that? Gravy... as far as the eye can see - for decades to come!

I'm going to be buying more Goldcorp shares. Lots more....

And when I get my own hedge fund? Look out!
_

Friday, December 10, 2010

Is TV Signaling a Top in Gold?

10 December 2010

I recently had some fun reading this article on Seeking Alpha (Is TV Signaling a Top in Gold? ) and every comment on it... I guess I did this intentionally for something different to do, as my working holiday is soon drawing to a close!

So if you're at all curious about my present thinking, I have salted and peppered comments throughout the discussion section following this particular article. Alternatively, you can find all of my comments on the Seeking Alpha site here, though they are out of context on the summary page.

In brief, the author of this article, Yoni Jacobs, has some fun with the idea that a recent gold prospecting reality TV show ("Gold Rush Alaska") might be signalling a top in the gold market, just as house flipping shows accurately signalled a top in the US real estate market perhaps 5 years ago. However, I found both the article and the discussion on the site to be so gold bullish that I actually added to my (short-term) positions in both gold and silver mining companies while in the midst of the discussion with other participants.

I made quite a few comments, and I won't repeat them all here. Perhaps the most fun idea was this one...

" OK, try this. Let's say one of the prospectors on this show runs into a motherlode and becomes a billionaire. Will we then see more imitative shows? For sure.

"However, how long does it take to develop a mine? Maybe a decade - not unlike developing new medicines. It is very slow and difficult, even if you have millions of ounces (look at Novagold for example, even with Paulson and Soros onside). So about the time he (or she) actually is a billionaire, we probably really will be in bubble territory in gold! So perhaps this is a predictor after all - with a ten-year time lag."

I also offered some thoughts in reply to CLH, who made this statement: "These comments answer my question--Is gold going up or down? 99% of the comments say up. For this reason I say down."

My reply:

"CLH... you are not conversing with a crowd of shoeshine boys here. (Comment: It is said that Joseph Kennedy sold all his stocks prior to the onset of the great depression when his shoeshine boy offered him a stock tip.)

However, the QUALITY of the arguments against gold is what triggered me to add to my Goldcorp and Pan American Silver positions today. That is, those who are arguing here against the gold bull are dissuaded from investing by quite minor concerns, indicating that there is not yet a clear view of what the gold bull is and the actual dynamics driving it. When the arguments against gold are based on substantial factors, then I will think twice about my long positions.

"For example, if the anti-gold camp were arguing that Ron Paul stands a substantial chance of forcing the Fed to reverse course, I would sit up and take notice.
(Comment: Mr. Paul was recently appointed chairman of the Domestic Monetary Policy Subcommittee of the US House of Representatives. He is the most vocal critic of the Federal Reserve in congress.) I hope you understand me. That would be a substantial development. However, Ron Paul doesn't have anywhere near the kind of following he would require - even in Texas - to turn this juggernaut around.

"Or if you could tell me that interest rates aren't going to rise (and increase interest payments on US federal debt to above the $1 trillion level), then I might think again. In fact, to digress to the interest rate issue - certainly rising interest rates will compete with gold for the attention of investors. but again, you have to have an analysis. If interest rates are rising because it is the end game for fiscal imprudence and its inevitable consequences ("Squanderville"), then that will not in fact draw investors out of gold. Do you see what I mean? Actually, I don't think I have seen a single argument here that militates against gold in terms of the fundamental reasons why it is rising. Thus my emboldened status as a gold investor, even to buy more today for the first time in several weeks."

One participant (TW) made this reply to one of my statements: " There are two sides to your argument, are there not? One is the side that you have presented. The other would be that the miners have not tracked with gold because the valuations on gold are unrealistic or unreasonable. One could postulate that the HUI:GOLD ratio will return to the mean through a price correction in GOLD."

I replied to TW as follows (my last comment):

"Todd. If gold is not in a bull market, then you are correct. My analysis and action all follow from that basic assumption, which we have discussed elsewhere.

"As to my investment philosophy, my strategy is to find a bull market and stick with it long-term. So far, the gold market has cooperated with that assumption, and the miners have given still equivocal affirmation! (I started buying in this sector in 2003, and wish I'd been there in 2001!)

"I will certainly begin to question my assumptions if at some point in the fairly near future the miners can't get onside in a more definite way! (I think they started this fall, by breaking out and up, as I have noted elsewhere.) However, bull markets have been widely documented to be volatile and frustrating. Investing is not gambling, because everybody can win. But that doesn't mean everybody WILL win in every sector at any given time. So yes, I'm trying to find the right place to be, and the signals are never 100% clear."


For more of this stuff, and for the ideas of many other contributors as well - many (perhaps not all) of them quite intelligent - click here.
_

Tuesday, December 07, 2010

True US Federal Debt Passes $71 Trillion...

7 December 2010

This chart (from Jeff Berwick's Dollar Vigilante) of true US federal government debt under GAAP (Generally Accepted Accounting Principles) shows current US debts about 5 times higher than officially stated ($71 trillion):

With a population of about 310 million souls, that means each American (man, woman, child) owes roughly $229,000 dollars on behalf of the federal government alone. As on and off-balance sheet state and municipal debts run about $700 billion (source: New York Times - last week; CATO estimates perhaps 3 times that much), you can add another $2,250 to that. Then there is personal and household debt, which I'm not going to add in to our calculations today - but it is still quite large (roughly $2.4 trillion)!

You get the picture, though.... It's at least $230,000 per individual just to manage government obligations related to money already spent (or promised to be spent)!

Let's assume that half of all Americans are active income earners (155 million Americans were employed in 2008). Well, all they need to pay (after taxes for current government operations and expenses, personal expenses, etc.) is then something over $460,000 or so - apiece. I'm just ballparking it here...

So how does this get paid off?

You guessed it, by currency devaluation or default.

Take your pick!

I'm investing in gold!
_

The Only Thing Worse Than a Bull Market Is a Bear Market!

7 December 2010

I'm still very busy, but will make a quick comment on how crazy bull markets are.

Gold has just set an all-time record high price two days in a row. However, in both cases, it pulled back after setting a new record high - today, sharply.

How have gold mining stocks responded? Yesterday they climbed modestly - that was underwhelming.

Today they are down sharply, to a lower level than where they started yesterday.

Does this look like a top in a bull market?

The answer: Not hardly!

Bull markets top out with over-enthusiasm (which leads to exhaustion), not fear.

I'm sorry, but this fear is excessive in response to such obvious signs of strength in the gold bull market.

Bull markets are maddening - but this crazy and irrational stuff is what they do. We are still climbing a wall of worry.

But take my word for it. Don't fight the bull market!

Where are we now? Once again - and we've been here many times before - we're cleaning out the "premature eradicators." This stage involves brief but sharp drops as nervous holders of gold and gold equities "abandon ship," in this case, as the port is in sight! Today's sellers are simply selling too soon....

Gold's new record highs are a sign of strength, not weakness. This is hardly the time to be selling gold OR gold stocks!!!
_