Dedicated to the life and work of Buckminster Fuller

22 August 2021 (continuously updated)
I foresee strikingly positive developments for humans and for life on planet Earth, based on the following trends:
- Fusion power
- Recycling/reuse
- Carbon recapture & planetary
cooling
- Habitat restoration
- Robotics
- Biotechnology
- Artificial intelligence
- Healthier lifestyles
- Expansion into space
beyond earth
- Safety technologies and preventative health
- Private property and human
rights/security protection
- Free markets, balanced budgets, creativity and entrepreneurial capitalism
- Cooperation, Shared Goals and Accomplishing More
- Paradoxes of prosperity and purpose | Subsistence as an alternative
- Ephemeralization
Let’s review these emerging trends one-by-one:
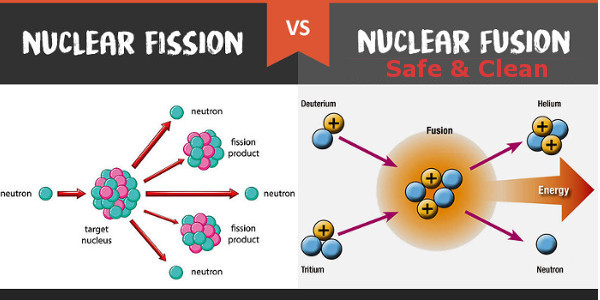
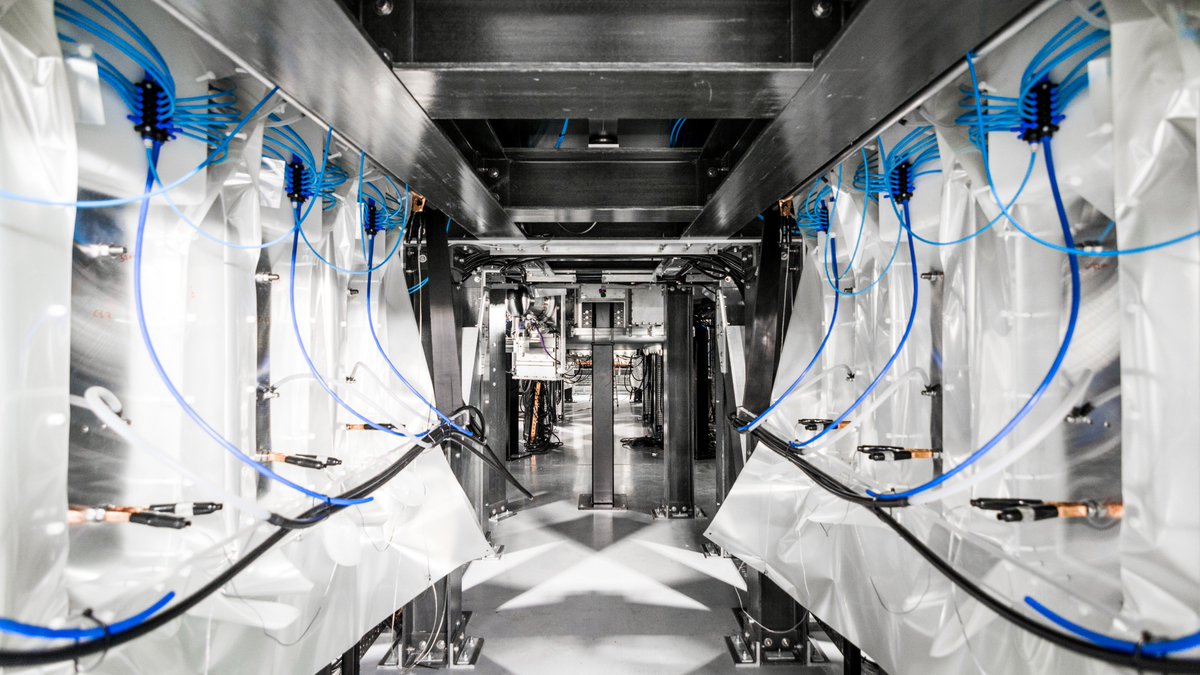
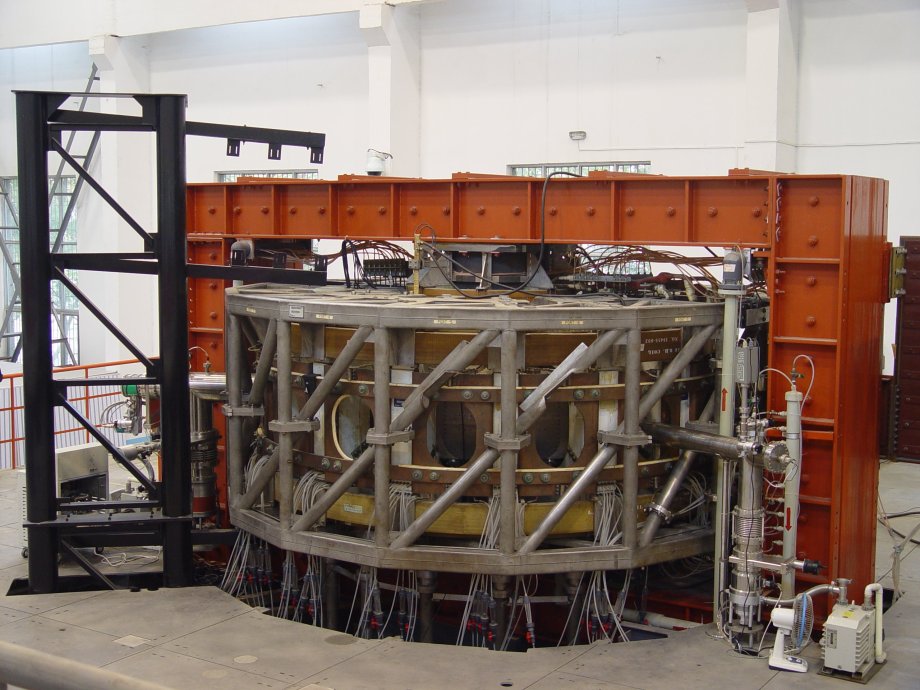
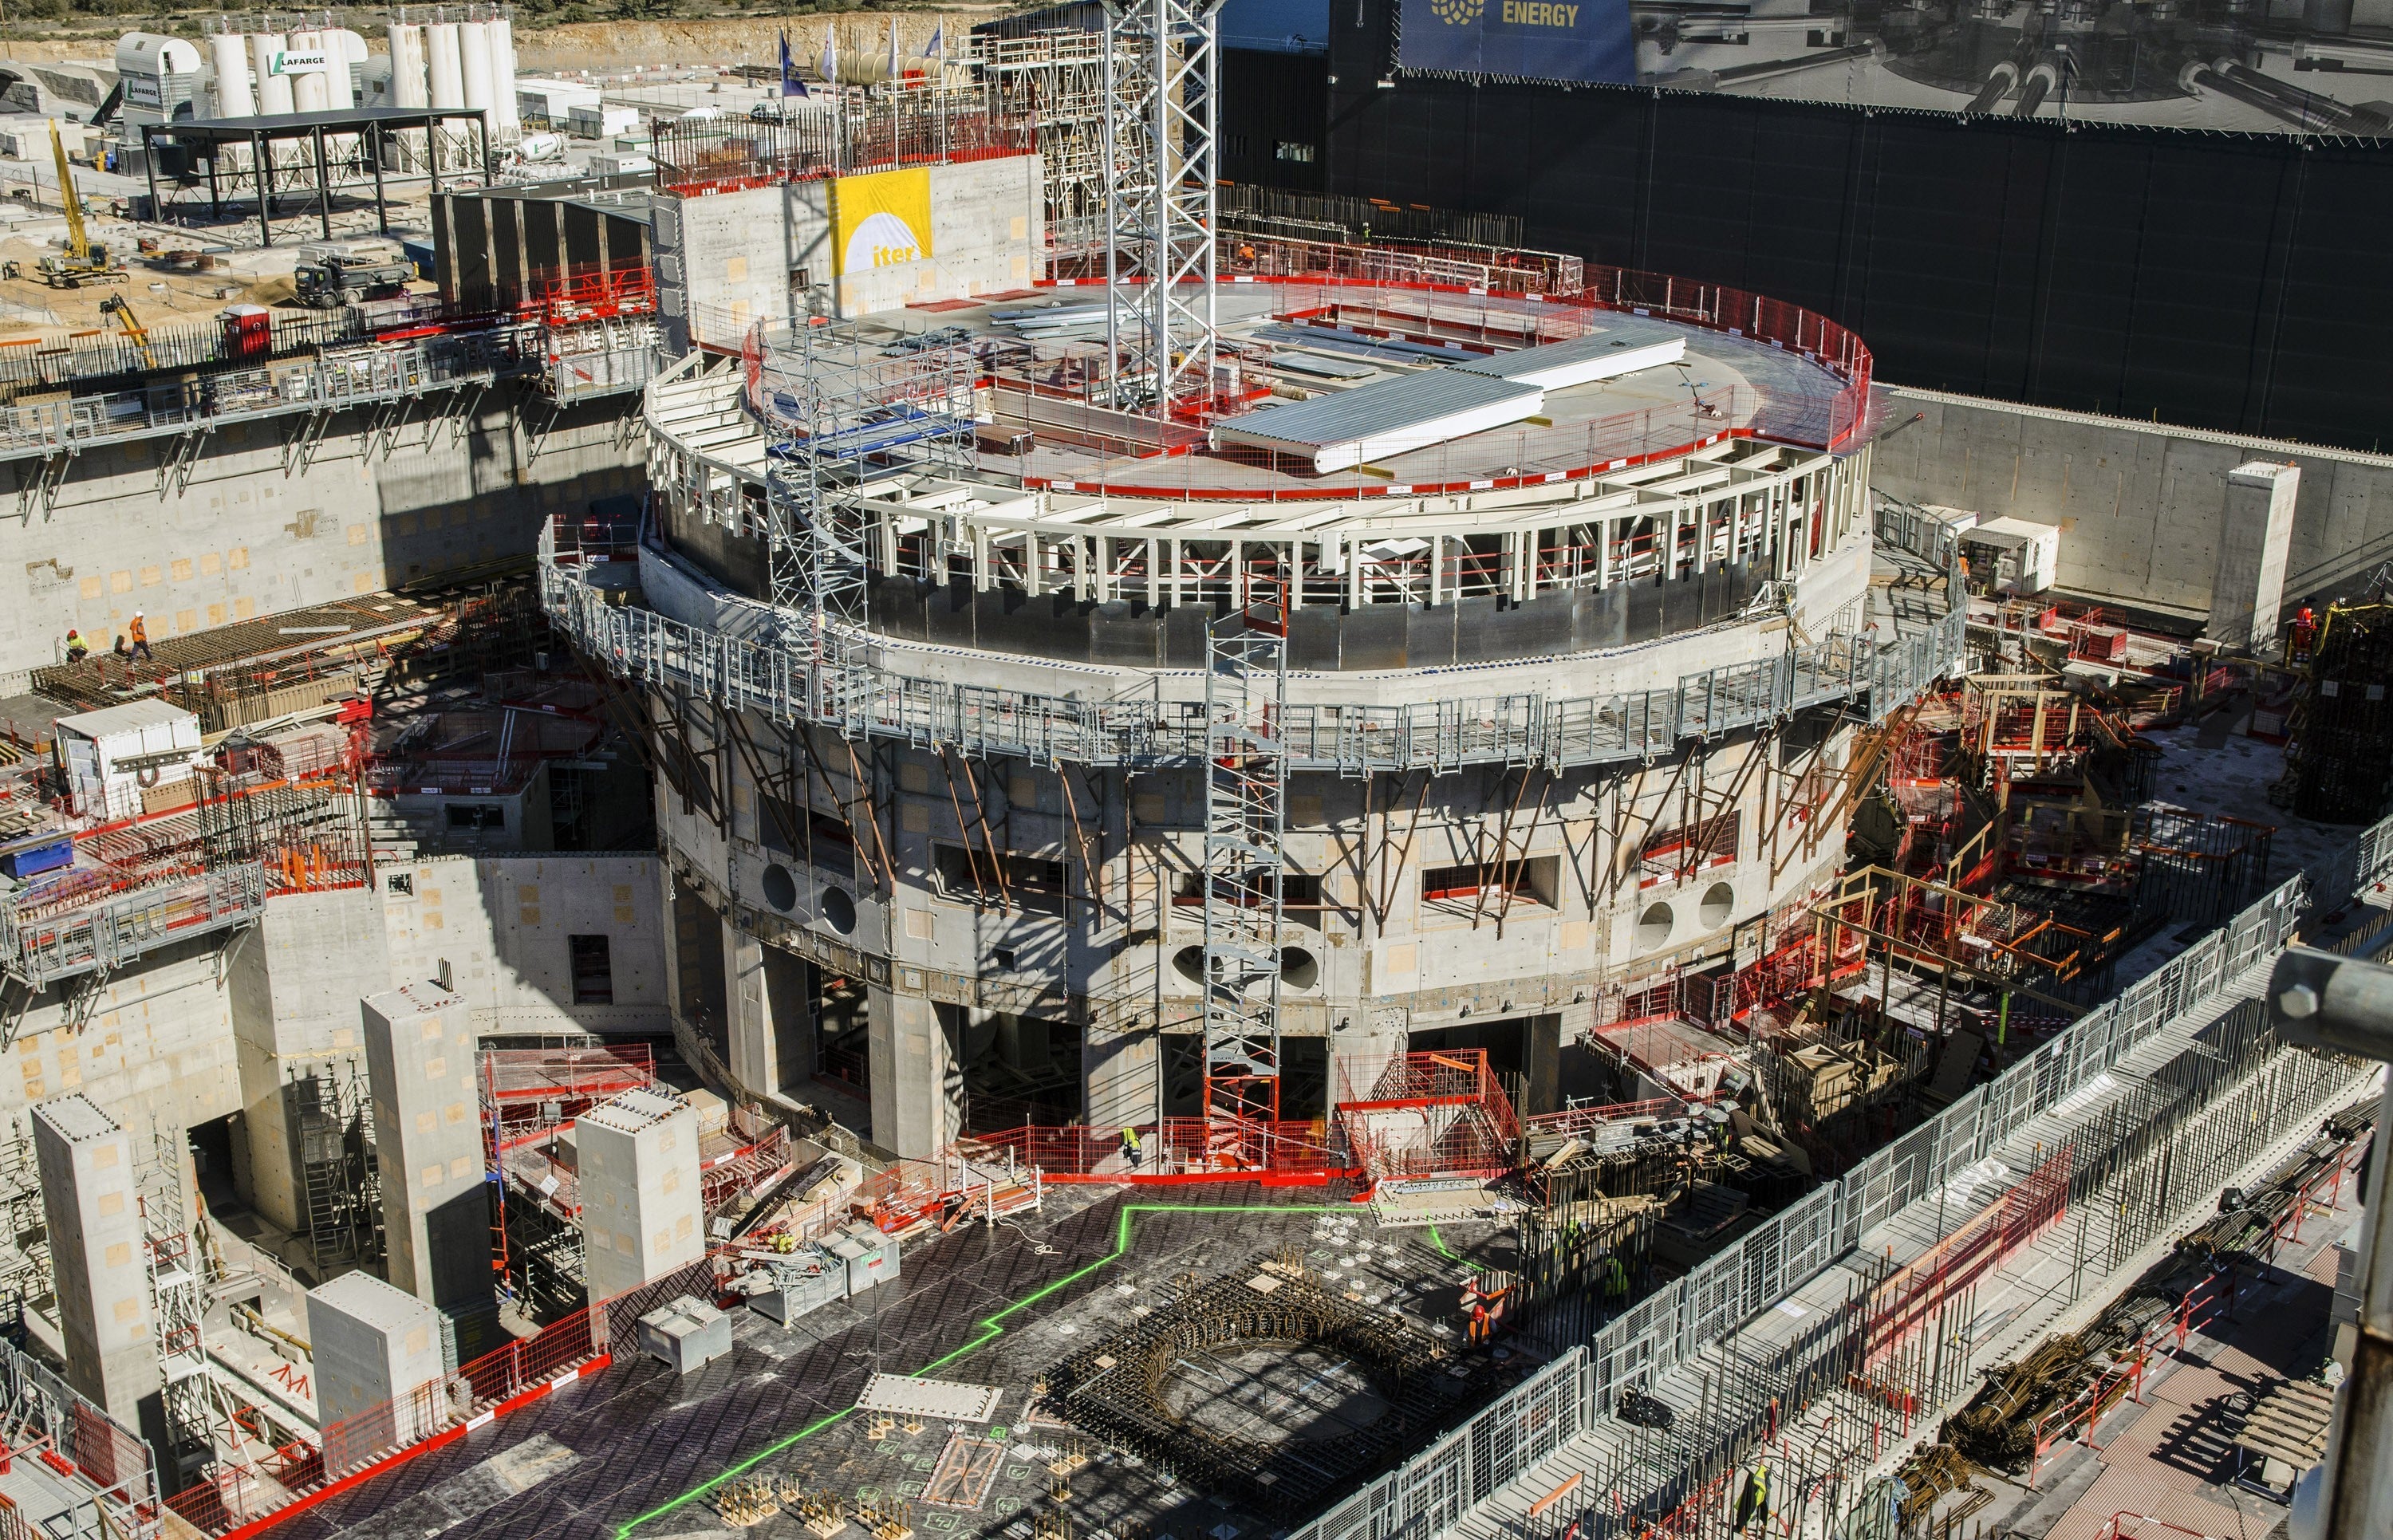
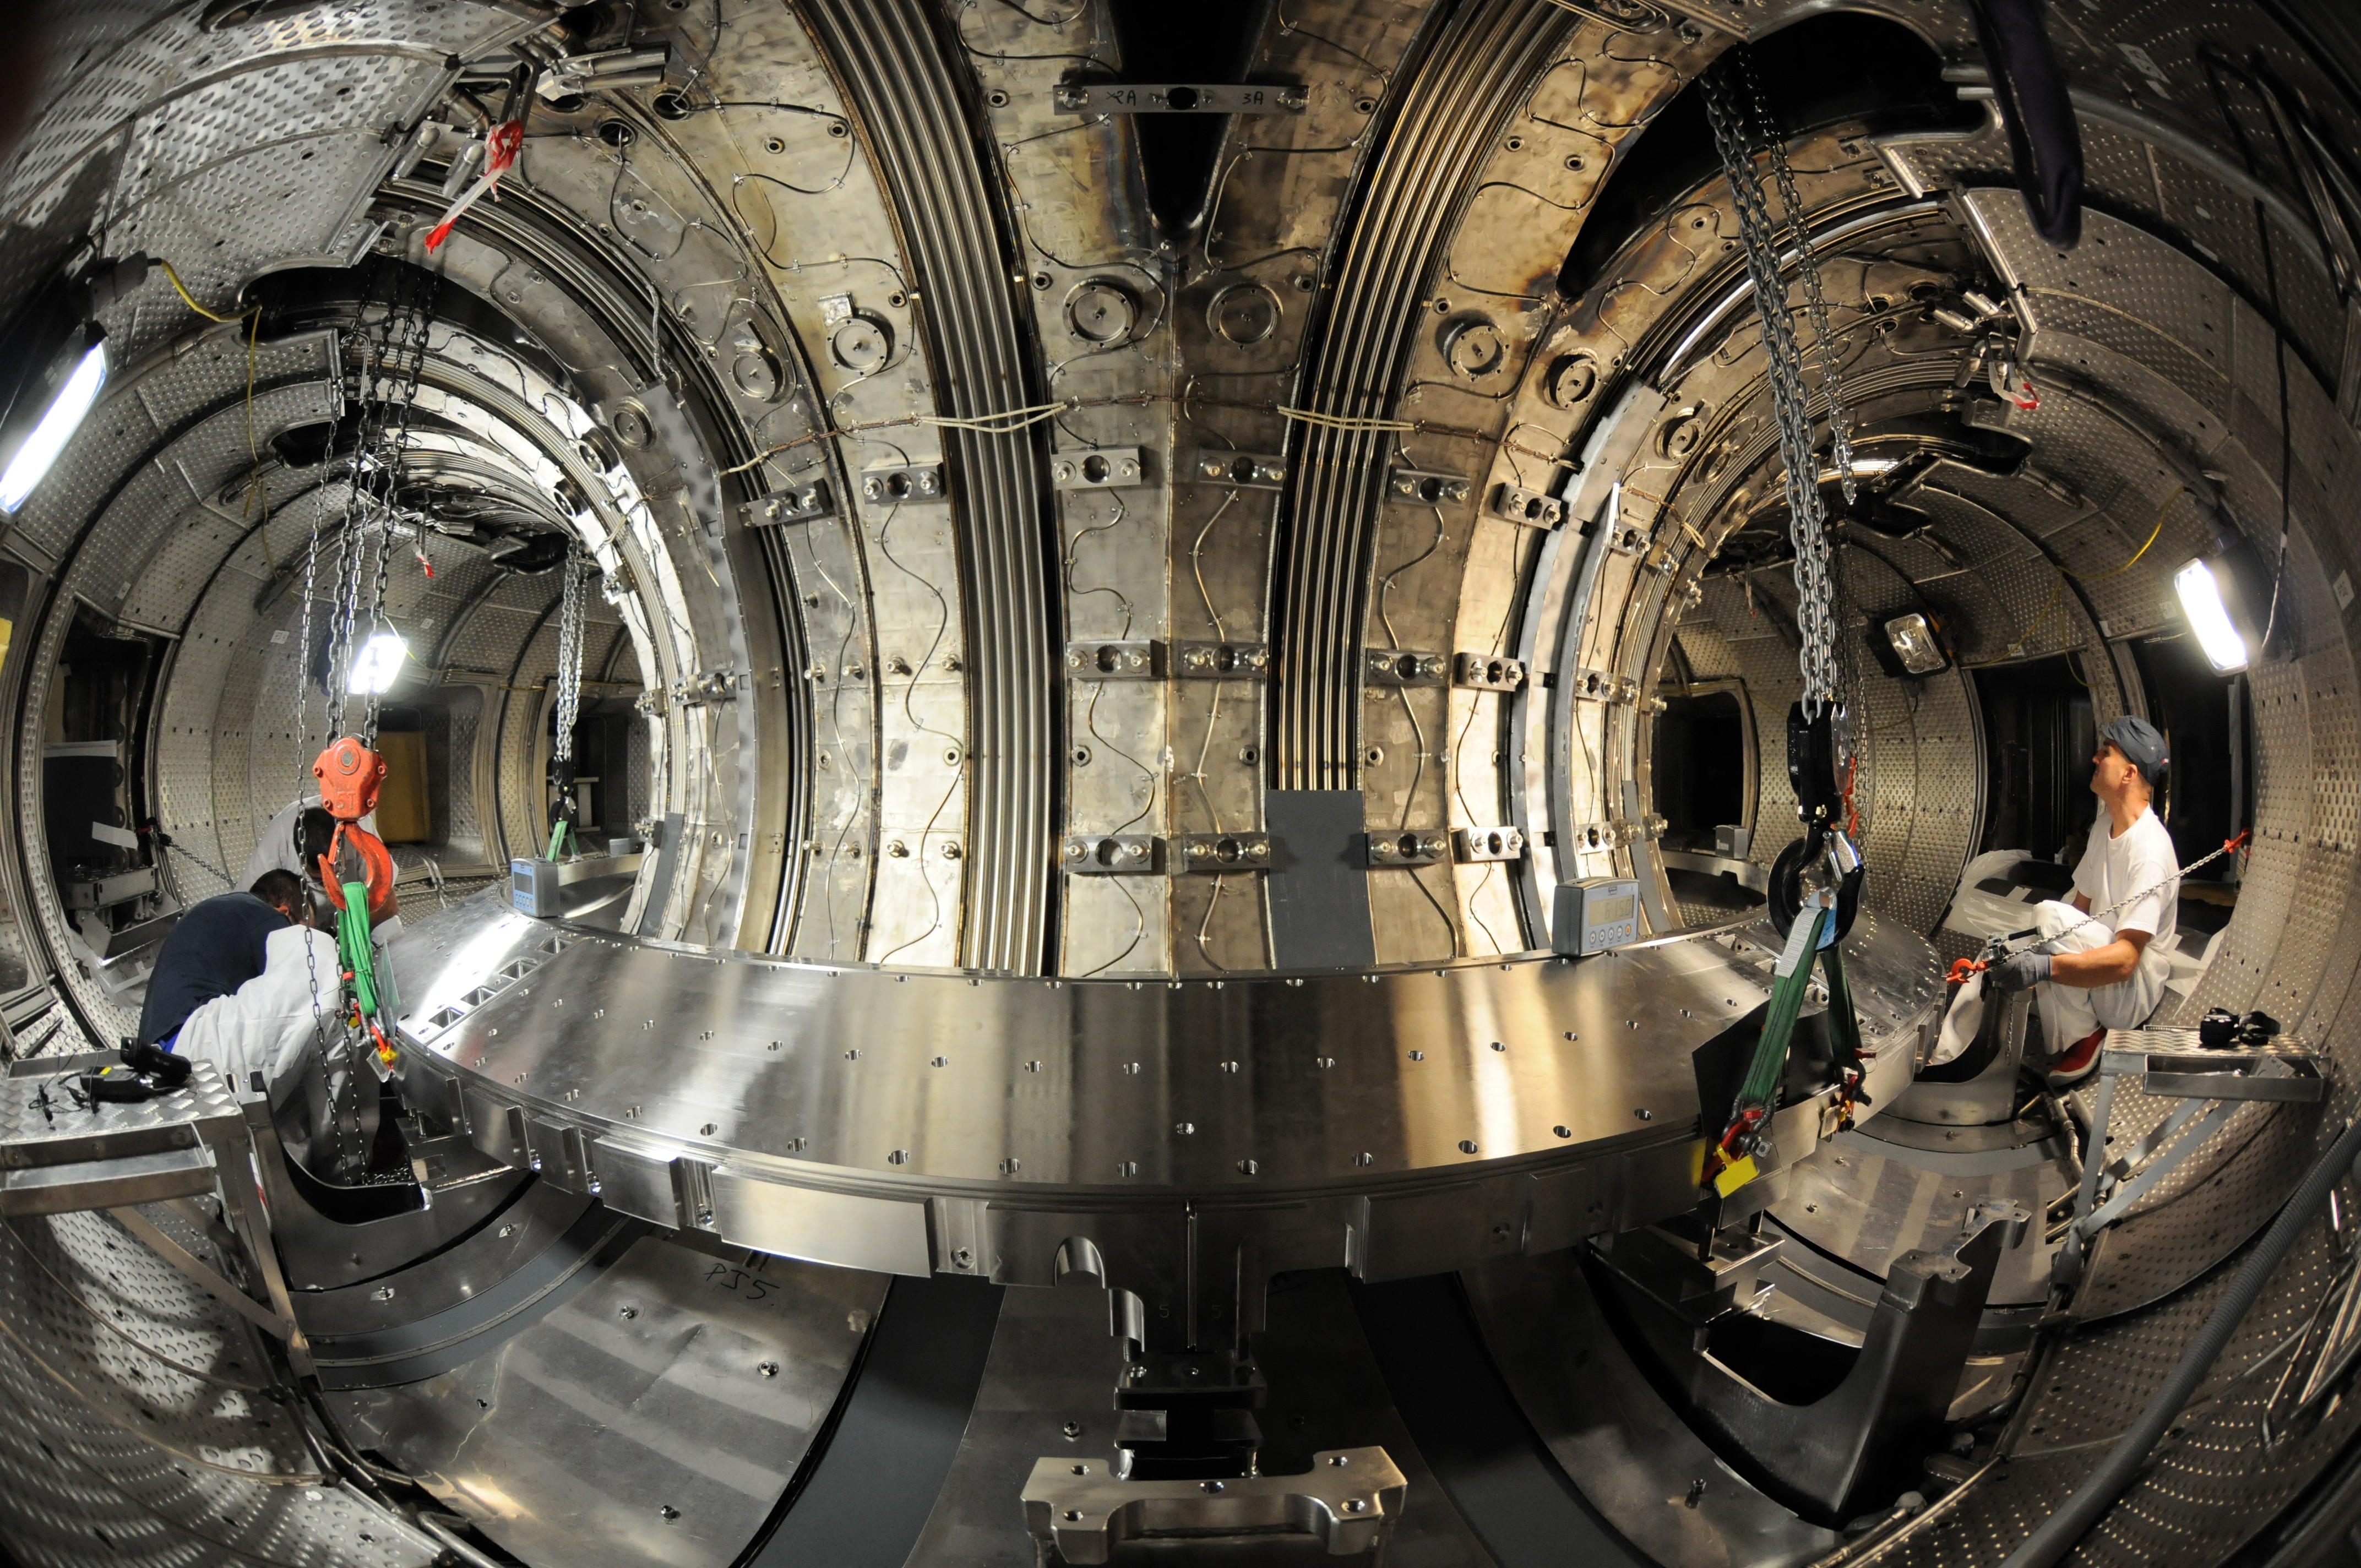
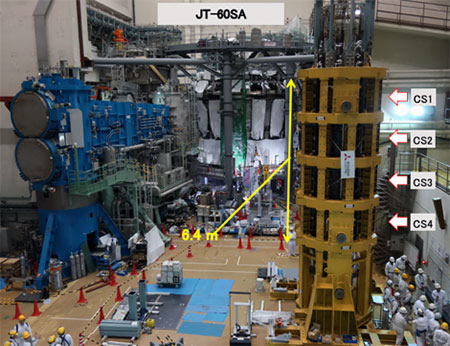
Fusion Power
Fusion power is abundant and plentiful, and is the primary source of energy virtually everywhere in the universe. Rather than employing low-density inputs, it releases vast amounts of energy from vanishingly small amounts of fuel. Unlike other energy technologies, the requirement to mine resources to support fusion power is minimal, as fusion’s primary resource utilization requirement is for plant construction, not for fuel supply.
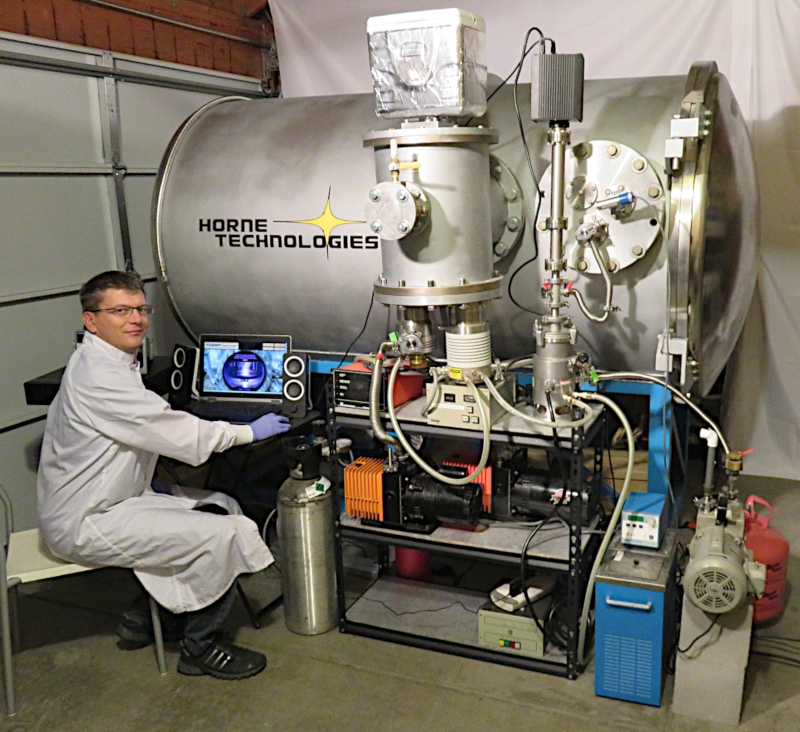
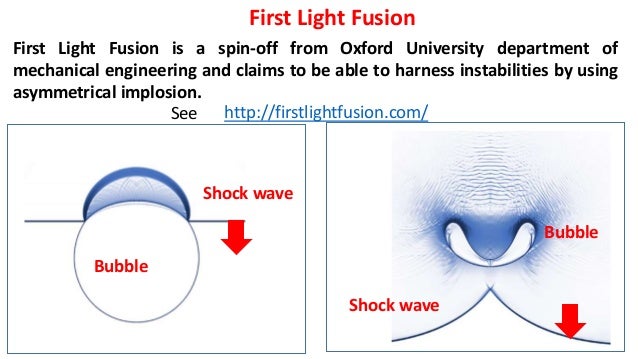
I am aware of over 34 different and quite diverse fusion power development initiatives around the world. Most are government-funded, but many are private. Interestingly, carbon energy companies appear now to be investing increasingly in a fusion-powered future, a trend which I expect to continue.
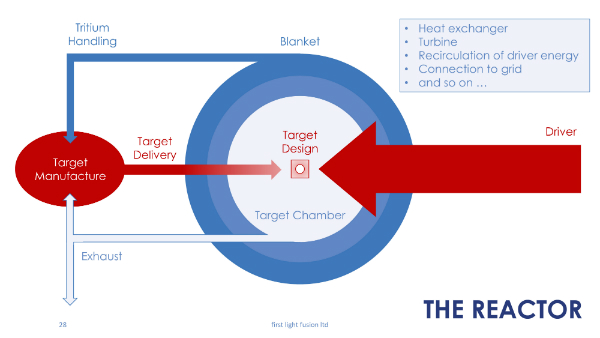
The fusion power initiative I currently find most promising is that of HB11 Energy. This Australian company is built on a half-century of research by Dr. Heinrich Hora, who long ago predicted that lasers would at some point be able to combine hydrogen and boron 11 atoms into three helium nuclei so rapidly that electricity (positively-charged helium nuclei and electrons) would be essentially the only output of the fusion reaction.
That is, HB11 Energy uses Nobel Prize-winning chirped pulse amplified lasers (now an existing and proven technology) to produce sufficient ponderomotive force to produce an instantaneous fusion reaction that does not release heat or radioactivity, and that, of course, is also carbon-free.
Burning carbon will quickly be seen as an outmoded technology. The same applies to nuclear fission, which we will certainly gradually phase out as fusion-based technologies advance. We will continue to use nuclear fission only for narrowly specialized purposes (e.g., medical isotopes), and we will begin to use carbon only to build things. Burning carbon and nuclear fuel, both, will soon become entirely unthinkable and be remembered as primitive.
Carbon, however, has a bright future. It will soon be employed only constructively versus destructively. Carbon is required for the synthesis of all organic molecules, and is also the backbone of such high-tech materials as graphene, Buckminsterfullerene, etc. Note that there is no need to oppose or block the development of our present carbon-burning infrastructure, which serves many needs well. We don't have to expend any effort to “shut down” the carbon-based energy economy. Rather, we will benefit by expediting the development of fusion power to make carbon burning (and nuclear fission) obsolete.
Obviously, low density, non-carbon energy sources will also have important applications, but fusion will power the grid, long distance space travel, and other high energy-demand human activities.
Will infinite, low-cost energy eliminate poverty? If we use it to advance human freedom and prosperity, which I believe we can, then my answer is a qualified “yes, we can, and so we should!”
Recycling/Reuse
With the advent of fusion power, we will possess the energy required to gather, reprocess and reuse essentially all materials presently employed by humans. With robots, artificial intelligence and other machine technologies, we will be able to carry out sorting at microscopic levels. Time and energy costs will be unimportant considerations. For materials that can’t be sorted microscopically, then fusion power can be used to heat and separate materials elementally, though heating will be a methodology of last resort – we still require a cooler planet.
Recycling and reuse imply that virtually all mining activities will be substantially scaled down, and some will be eliminated. This will aid the cause of habitat restoration. Note that mining for new materials, for example, rare earths, may continue or even increase, due to new and emerging technologies.
Carbon Recapture & Planetary Cooling
Some who oppose carbon recapture and combatting global warming argue that much higher atmospheric carbon dioxide levels are normal in Earth’s geological history, and thus that our planet “already knows how” to have a more carbon-rich atmosphere and/or to be hotter than it is now, which is entirely true. Many in this school also argue against efforts to cool the planet. The “anti global-cooling” argument is many faceted, and more complex than I wish to summarize here.
My argument here, by way of contrast, is that lower atmospheric carbon levels (and lower global temperatures), though relatively uncommon in our planet’s geological history, are supportive of far greater ecological diversity. Thus, I am making a value judgement in favour of the ecological diversity that comes part and parcel with a relatively cool Planet Earth, a principle strongly supported by multiple branches of biological, geological and other sciences.
If Planet Earth can correctly be thought of as a “spaceship,” as originally argued by Buckminster Fuller, then we will need to define some operating parameters for our live-aboard spacecraft. Maximum ecological diversity provides us protection against multiple threats and imbalances, including communicable diseases, geological disruptions, human conflict, etc.
Of course, plants recapture carbon by their very nature, returning it primarily to the soil. Habitat restoration (below) will thus aid significantly in the sequestration of carbon from the atmosphere. A large part of recapturing carbon will thus prove to be exactly the same thing as restoring habitats to prior and/or more diverse states.
Additionally, carbon can be recovered from the atmosphere (or from human environments and activities) by multiple human technologies currently in development. A particularly promising method returns carbon to the oceans as carbonate, which will also aid in reducing ocean acidity as well as overheating.
Carbon recapture can be powered by a mix of technologies, including fusion, solar, wind, tidal and other noncarbon power sources. The use of multiple power sources will help to accelerate the pace of development of carbon recapture initiatives.
Habitat Restoration
David Attenborough has been particularly eloquent in arguing for and summarizing the benefits of habitat restoration. A limited list of others who have spoken to this purpose include Joseph Kittredge, Masanobu Fukuoka, Bill Mollison, Paul Ehrlich, John Muir, Louis Bromfield, Helen & Scott Nearing, and many, many more.
Despite their complexity and obvious imperfections, natural habitats that have developed through untold millennia of natural selection have extensive benefits for all life forms on our planet, particularly in that diverse species can thrive in balance with other species without their numbers growing overly large or small.
Restored and/or intact habitats are so generative that they can compensate for quite large areas that have been disrupted by human activity, thereby preserving the health and wealth not only of humans, but of all species. Robotics, powered by fusion energy, can aid us not only in restoring habitats (replanting, rebalancing, etc.), but also in protecting them from disease, disaster and human disruption through non-violent surveillance and intervention, which will increasingly be accomplished by technological means. Poaching, burning, unlawful harvesting, etc. can be prevented without violence through multiple emerging robotic and intelligent technologies.
In turn, intact habitats can be harvested in a balanced manner to support human health and prosperity in combination with ecological balance, as David Attenborough has extensively documented.
A note on human population: There is ample emerging evidence that human population numbers tend to stabilize or even decline under conditions of prosperity. Advancing prosperity and full economic participation by all humans will do much to regulate human population. This natural balance may or may not be sufficient to permit restoration of habitats.
The restriction of human reproductive choice can probably safely be considered a last option in pursuing habitat restoration. For example, human cities can be built more compactly, with less sprawl; possibly large numbers of humans may eventually live off-world in the farther future; and much evidence, both technological and cultural, confirms that humans can also live in harmony with land and water habitats, including improving them and increasing their diversity, while also withdrawing resources from them.
Robotics
While I am not a student of robotic science, it is evident that this area of technology is developing rapidly, and that robots can perform increasingly sophisticated tasks (1) that humans do not want to do, and (2) in many cases, better than humans can do.
Ethically, I do not advocate restricting robots (machine-enabled artificial intelligences) from replacing humans in cases where robots can outperform humans. It is important to consider that robots can do “almost anything” that is mechanical and repetitive, and increasingly more tasks that currently require professional judgement.
It is my view that as robots advance in their capabilities, they are least likely to acquire what we refer to as “wisdom.” That is, accomplishing wise delineations of issues and making decisions about their costs and benefits, will almost certainly remain a human prerogative.
If robots can increasingly replace not only menial labourers and human-guided machines, but also professional decision-makers (e.g., medical doctors, engineers, teachers, accountants, etc.), then what are humans to do? I will return to this question later when discussing economics and human purpose.
Biotechnology
I have chosen the heading “biotechnology” to refer to all the activities in which we will increasingly engage to further human health and minimize disease. My purpose here is not to answer the more difficult ethical questions (e.g., “should we redesign humans genetically?”). However the ethics eventually sort out (I'm reluctant to predict), we will certainly employ biological sciences to make humans healthier, to extend human lifespan, to prevent disease, and to minimize the depredations of disease.
The biological mechanisms of the human body, and indeed, of all plants and animals, are incredibly complex, and often seemingly paradoxical, when contrasted to the comparatively limited scope of our intelligence and still very partial knowledge.
Biotechnological progress will very likely proceed by fits and starts, but it is almost certain that the above generally desirable outcomes will increasingly come within our reach.
Longer lifespans will certainly raise complex questions of social justice and policy, not only concerning population regulation, but also regarding the inevitable shift of human populations towards a majority of chronologically older and older individuals (a shift that is already in process). It is also likely that the reproductive period of humans will be extended. My point is that however we resolve these questions, humans will increasingly be healthier and live longer. This will by and large amount to a very good thing, despite the secondary problems which improved human health and longer lifespans and reproductive spans may also imply.
Artificial Intelligence
Discussion thus far has already touched on multiple areas in which artificial intelligence will be employed, including its beneficial and some of its potentially problematic impacts.
In brief, artificial intelligence will replace human intelligence almost entirely in carrying out routine tasks, increasingly in carrying out complex and judgement-based tasks, and probably to a lesser degree in matters requiring wisdom and policy-making.
Let me acknowledge that many are concerned about the present and potential further abuses of artificial intelligence in human surveillance and behavioural control, a tactic universally employed by totalitarian governments. As an advocate of human freedom, I certainly foresee a world in which the range of human choice and freedom is large, and in which proscribed activities are few and fundamental to justice.
I generally favour the Western liberal democratic tradition with respect to preserving and protecting freedoms of speech, opinion, movement and association, however imperfect that tradition may have proven itself in practice, both historically and at this time. This is a very difficult area and it is challenging to do it well.
My discussion from here proceeds on the assumption that fundamental human freedoms will continue to be well-protected. I believe there is sufficient evidence of progress on this front that my assumption can be viewed as reasonable, though it is certainly also optimistic. Human freedom will continue to require vigorous defense, and there is no doubt that such defense will continue to be personally costly to many.
I have not yet mentioned the domain of creativity, innovation and originality vis-à-vis artificial intelligence. In addition to wisdom and policy-setting, it is my view that humans will increasingly occupy themselves with tasks and activities involving creativity, innovation and originality. Very likely, our educational strategies will need to address increased attention to the domains of human originality and productivity.
A final area in which humans will not be replaced by artificial intelligence will be in the domain of interpersonal relationships (though there will be large areas of overlap within which very complex ethical and policy decisions will still have to be made).
My current view is that much of our daily, weekly and annual scheduling that is currently taken up with employment and other routine duties will be replaced by relationship-focused activities of many kinds. For example, children's education, much of which can be guided by artificial intelligence, will continue to require a necessary and very substantial component of peer relationship development and adult mentoring and role-modeling. Also, as “wisdom” cannot, by my definition, be taught via artificial intelligence, adults will continue to be highly engaged in the education of children and adult learners, and this will remain a somewhat intensive and probably lifelong activity – and duty, for many.
Healthier Lifestyles
As biotechnology advances, it is possible that exercise, fitness, sports and physical recreational activities will be advanced to some considerable degree via biotechnological interventions. For example, we will almost certainly develop and employ supplements and other technologies that artificially increase strength and agility, aid in weight regulation, etc.
However, I have read extensively in the field of exercise science, and there is much accomplished by exercise and activities requiring/developing agility that will be very difficult to replace via biochemistry, molecular biology and artificial intelligence.
While mild exercise has many documented benefits (including, importantly: telomere extension, prolonging productive lifespan and stem cell activation, including new brain cell growth), current research shows that the most dramatic benefits accrue from high intensity exercise, including muscular effort against increasing resistance and recurring levels of effort of 20 seconds or longer at or near one’s maximum safe heart rate.
A partial listing of the extensive benefits of intense exercise include: (1) tissue hypertrophy and increases in strength/density (especially muscle, bone and connective tissue); (2) tissue repair (for example, reversal of arthritic symptoms; wound healing); (3) metabolic regulation & optimization (e.g., lowered resting heart rate, blood pressure, serum cholesterol and sugars; improved insulin sensitivity; reduced hyperarousal; accelerated systemic signalling & improved systemic efficiency); (4) heightened immune system functioning; (5) increased aerobic metabolism of energy sources in mitochondria (aerobic oxidation is 16 times more efficient than anaerobic fuel metabolism); (6) mitochondrial proliferation in fat cells (mitochondrially-dense brown fat cells continue burning energy for 48-72 hours following intense exercise, aiding in weight regulation); (7) preferential burning and reduction of interstitial fat (reducing fat around internal organs); (8) profound anti-inflammatory benefits (interstitial fat is the primary releaser of inflammatory molecules which exacerbate all inflammatory illnesses, including cardiovascular disease, cancer, diabetes, autoimmune conditions, etc.; signalling molecules released by contracting muscles also combat multiple additional inflammatory processes); (9) increased circulatory capacity, including blood cell proliferation, increased circulating blood volume, and growth of new capillaries; (10) capillarization of the alveoli (lungs), specifically, increasing the air/red blood cell interface, and thus the amount of oxygen delivered to the bloodstream via respiration; (11) increased endurance, energy, and resistance to fatigue; (12) multiple psychological benefits, including antidepressant and antianxiety effects, improved attentional self-regulation & executive functioning capacities, and, importantly, heightened optimism and positive interest in one's surroundings & relationships. This listing is not exhaustive, and we have probably identified so far only a small part of the total benefits of intense exercise.
Notably, and directly related to the above summary, contracting human muscles release over 650 biologically active signalling molecules (myokines), the functions of most of which are not yet understood, or are partially understood at best. Because of the complexity of these biochemical processes, there will probably never be a substitute for physical effort, practice and skill refinement, even when we become more able to enhance strength and endurance via biotechnology, artificial intelligence, prosthetics, etc.
Returning to the question of obviously increased human free time, I am assuming that for most persons, increased allocations of time to physical exercise and to the development of strength and agility will occur. This will yield further human health benefits, including heightened safety and accident prevention, as well as the obvious gains which may accrue from a continuing emphasis on the importance of socialization.
Note that the safety benefits of exercise are manyfold, including improved resistance to injury via tissue strengthening; practice effects, improving readiness for unanticipated and off-balance situations; heightened alertness, including body and environmental awareness; improved coordination and balance; improved reaction time; strength-based efficacy; and many more.
Healthy lifestyle habits will increasingly be instilled in childhood, and this will almost certainly become a primary focus of education as well as of free time usage.
Expansion into Space beyond Earth
I have been arguing for some time against the artificial dichotomy of “here on Earth” versus “out there in space.” Earth is literally a “spaceship,” and in fact nothing other than a spaceship. It is a live-aboard vessel hurtling through our corner of a vast universe at an incomprehensible speed. We are already spacefarers, whether we like it or not.
Further, space is a vast, if initially hostile, habitat, offering not only adventure and resources, but also potentially safer abodes, habitat diversification and a bigger view of the “natural world, writ large,” including yet-undiscovered natural events and processes, new substances and still unimagined natural laws and principles, which may importantly inform our scientific investigations and enable a continuing acceleration of progress.
The primary threat of space is radiation, but we are quickly identifying new materials which hold promise of shielding us from radiation, including, recently, graphene and selenomelanin, with a promise of very likely many more such new materials. Biotechnological interventions may also prove significant. I'm currently optimistic that the radiation problem in space beyond Earth’s geomagnetic field will gradually be “solved.”
A second challenge in our expansion into space beyond Earth is loss of strength and body mass through leaving earth’s gravitational well. It is possible that we will initially do better exploring the regions of space beyond Earth through artificial gravity space stations than by colonizing moons and planets with substantially less gravity than Earth. Possibly, biotechnology will eventually aid us with remedies to this problem. Machines for low or zero gravity exercise have already been developed, and these will be necessary for the foreseeable future.
Space exploration will obviously expose us to a tsunami of new facts and discoveries, and this will include new materials, new chemicals, new biological processes, and new understanding of our own biology and technologies when faced with the unique challenges of extraplanetary travel. There will absolutely be an explosion of scientific discovery accompanying our ventures into our universal habitat beyond Earth.
Stated differently: We are already citizens of the universe. That we currently inhabit a single planet within this universe is very clearly a starting point, not an end point. There is no inherent limit to how much of our universe we may ultimately decide to explore and make our home. For all practical purposes, our options are infinite.
Safety Technologies and Preventative Health
Something I think is already in process, and that will begin to alter our lives dramatically, is the change in our tolerance for unsafe situations and practices, despite their current commonality. Automobile travel is the most obvious example, but it is not the only one. Many occupations involve unsafe situations, and we tolerate high-risk behaviours in such activities as sports that are likely to be re-evaluated in the fairly near future (e.g., concussions resulting from blows to the head in boxing, heading soccer balls, etc.).
I can’t offer a moral prescription here, or advise anyone else as to the level of personal risk s/he should deem acceptable. I'm not out to stop boxing or to change the rules of soccer/football. Rather my point is that, as a society, we are already moving rapidly in the direction of being less tolerant of preventable risk. Also consider that injuries resulting from high-risk activities are very costly to humans, both in financial and quality of life terms. In fact, the costs associated with injuries are escalating, in part because we now have more, and more expensive, treatment options available, injured persons are more likely to survive, even if they are very disabled, etc.
I think it is a certainty that we will stop tolerating high levels of injuries, deaths and disabilities resulting from traffic and travel accidents. Artificial intelligence and other technologies will be combined to minimize injury and loss of life. Over time, we will also have increased “biotechnological” and biomechanical interventions to aid recovery from injury, minimize disability, and promote rehabilitation.
My analysis for at-work injuries is similar, and I think it’s likely that our tolerance for sports and recreational injuries, already decreasing, will continue to decline, in large part because our awareness of injury and prevention mechanisms is also expanding.
Note that improving safety and reshaping our environments so that injuries of all kinds are less likely is just one subset of the preventative health measures that will ultimately become possible through continuing progress in the fields of behavioural and mental health, biotechnology and social cooperation.
The above discussion is notwithstanding that risk-taking is actually essential to human mental health (and arguably also, physical health). Individuals who avoid or are unable to take risks tend to live restricted lives and to suffer from higher levels of mental health problems. That is, I'm not arguing against risk, but against unreasonable risks with no “edge” in terms of their potential payoffs. This is often a judgement call, and I would come down on the side of human freedom when judgements require to be made, though I would also argue for informed (educated) decision-making, particularly when those undertaking risks are put into those situations by others, or when they are dependent on others for their own (perceived) safety.
Private Property and Human Rights/Security Protection
The core and most essential ingredient of modern prosperity is the right of the individual to secure private property and for the person’s right to ownership of that property to be protected by a system of laws. The contemporary economist Hernando DeSoto has compiled extensive evidence that global human poverty is attributable first and foremost to limitations on rights of ownership and to restricted or nonexistent legal protections of persons and personal property.
The modern-day case of China is a compelling example of an explosion of wealth in the aftermath of the (partial) replacement of Maoist communist ideology by a new system of laws that instituted protection of private property ownership to a degree that was historically distinct (note that this new system is now being eroded, and that this decline in property rights and protection is reducing China’s wealth as a consequence).
This emphasis on the primacy of individual property ownership is obviously contrary to much liberal and collectivist ideology, and requires some discussion. Let me state my case in positive terms.
Essentially what I'm arguing is that capitalist prosperity affords such an abundance and overflow of wealth that the goals of most liberals and collectivists (equity, security, opportunity) are also best advanced by private ownership (capitalism) because capitalist wealth establishes a “social” foundation that is necessary and sufficient for the achievement of non-monetary goals (health, education, social security, equal opportunity, etc.).
When poverty results from limitations on or failed protections of private ownership, then the above popular liberal aims become increasingly difficult and ultimately impossible to achieve.
Additionally, when private property is protected, and for the moment setting aside concerns about how wealth is distributed, this establishes a framework in which human rights generally can be better protected. That is, a prosperous society is inherently more stable, and accumulated wealth literally provides the funding needed to open more and more doors to disadvantaged groups.
Questions relating to the equitable distribution of wealth are addressed in the following section.
Free Markets, Balanced Budgets, Creativity and Entrepreneurial Capitalism
Much has been written over many centuries about why free markets advance prosperity. I am not attempting here to duplicate that discussion. I think that currently, the primary issue at stake is that of inequity in light of an excessive concentration of wealth among a very few ultrarich individuals and families, and I will state immediately that the maldistribution of wealth, as it exists now, is indeed a bad thing, and amounts to a current crisis situation. A case can be made that the redistribution of wealth is in fact the primary cause of social conflict and unrest, including a primary cause of war.
However, there is ample evidence that capitalism in itself does not cause maldistribution of wealth, though by its very nature it produces unequal distribution of wealth (the two are not the same thing). Adam Smith wrote extensively about how the “invisible hand” of the market, driven, if you will, by human “selfish interest,” tends paradoxically to result in increasing prosperity for society as a whole – because economics is very much not a “zero sum game.”
Market economies by their very nature expand and multiply wealth, resulting in ever more prosperous and abundant societies and an ever increasing range of choices for individual humans.
Ludwig von Mises developed a more refined and comprehensive view of how humans, choosing freely in unimpeded markets, specializing in various skills, and trading with whomever they choose, wherever they choose (that is, engaging in “free trade”) create increasing levels of wealth via each one of these processes and more.
There is strong historical evidence in favour of the argument that free markets not only promote general prosperity, but also aid in the fair and just distribution of wealth. Let me offer just one example. From the time of the Great Depression through the 1960s (approximately 4 decades), the trend in the distribution of wealth in the United States favoured the middle and working classes over wealthier individuals. Working people thus enjoyed an ever-increasing proportion of the nation’s wealth for the duration of that almost half-century timeframe, throughout which the American economy was very much free-market based, in fact, much moreso then than it is now.
If capitalism is not the cause of the current inequitable redistribution of wealth from the middle and working classes to the ultrarich, then what is?
Once again, Mises offers what I consider to be a very good answer. In his view, maldistribution of wealth results when a central authority interferes in the operation of free markets. This is not a difficult concept. When anyone “manages” markets, then prices are no longer set voluntarily by the market’s participants, and those placed nearer to the centres of power are in a position to anticipate the direction of the “policy-based” interference to gain personal advantage. This tilting of the playing field is not only unrelated to capitalism, but in fact, contrary to the first principle of capitalism (that markets should be free and unmanipulated).
In the 1920s, prior to the Great Depression, there was a concentration of wealth among the very rich, because the ultrarich were able to utilize their economic power to influence governments at all levels to give them unequal advantages vis-à-vis monopoly power to the explicit disadvantage of other market participants. In this case, maldistribution of wealth was attributable to the ability of the very rich to “buy” government intervention in the markets on their behalf, enabling them to quash their competitors through now illegal practices, which even at the time were described as “anti-competitive behaviours” (price-fixing, locally undercutting competitors’ costs, etc.). After the ultrarich were damaged by the Great Depression, the recovering markets in the absence of their now-illegal behaviours were able to distribute wealth more fairly, precisely because the markets were less manipulated.
In our current situation, the problem causing our markets to be “unfree” is essentially threefold.
(1)
Central banks around the world are interfering
in markets by suppressing interest rates and artificially increasing the supply
of money, literally by printing money out of thin air, which they call
“quantitative easing.” Accompanying ultralow interest rates encourage both
governments and speculators to borrow far more than they otherwise would, and
by historically unprecedented margins (literally trillions of dollars are now borrowed
by global governments and corporations annually; this has never happened before
in world history outside of war circumstances).
(2)
Beyond the above already problematic situation,
global central banks also purchase assets. These consist primarily of
government bonds and mortgage-backed securities, but in Europe, Japan and China,
also include the marketed shares of private corporations, literally forcing
stock markets higher. The central banks also follow a policy of “openness,” by
clearly communicating their policy directions well in advance. While this may
sound progressive, it is actually a signal to speculators as to which assets to
buy, as artificial central bank demand runs up the prices of the assets they
purchase through the time-honoured principle of supply and demand.
(3) Perhaps the most subtle problem is that when the central banks interfere in the market economy, they introduce “false,” that is, artificial, demand signals into the market. This in turn distorts prices (the price of anything that is in demand, whether artificially or otherwise, will increase). Mises called this “asset misallocation.” That is, market participants no longer invest capital in the real economy, but in the artificial economy manufactured by well-telegraphed central bank asset purchases. Assets are thus employed unproductively, for short-term gain (that is, to “buy what the central banks are buying” or to issue debt at artificially low rates, the returns from which are then paid out to corporate insiders in options and dividends). As a result of capital misallocation, this “financial engineering” in fact weakens the real economy, as investments are withdrawn from “Main Street” businesses and reallocated to “financial products” (e.g., bonds, options, stock purchases, financial derivative contracts, etc.). Thus, a financial bubble results in this “engineered” economy, encompassing stocks, bonds, real estate and collectibles, and the Main Street economy suffers, along with working and middle class people, who are not participants in the central bank-created “artificial economy.” The current financial bubble, which is sucking wealth from working people and transferring it to wealthy asset investors employing financial engineering, is arguably the most egregious in history. Importantly, please take note that the current “Wall Street” financial asset bubble has nothing to do with capitalism. Rather, it is the result of intentional central bank disruptions of financial markets, thereby creating the severe and increasing imbalances described above.
What would happen if the central banks stopped “managing” the markets and set them free again? I predict two results:
(1) The
asset bubbles created by financial engineering would gradually (not suddenly) collapse,
placing downward pressure on financially-engineered assets. That is, stocks,
bonds, real estate and collectibles would begin to fall in price from their
current lofty highs, and this decline would continue for many years, based on
the many years of distortive central bank interventions that were required to
create the asset bubble in the first place (by my reckoning, the current round
of excessive interference of central banks in the markets – emphatically not
the first in history, just the current one – began with Allen Greenspan’s
appointment to the Chair of the US Federal Reserve in 1987, 34 years ago at the
time of this writing).
(2) The resulting asset price “deflation” would have some parallels to the 1930s, which is the last time that there was a substantial collapse in the assets of the very rich. There would be an immediate shock to the global economy at all levels. Everyone would be affected. However, after the initial shock, and without the market-distorting influence of the central banks, the free market would once again set prices based on what real people actually want to buy or sell. In turn, this would redirect investment away from purely financial assets and back to the Main Street economy. Once again, the financial situation of working and middle class people would resume its improvement relative to the ultrarich (as had occurred previously, as described above). My argument is that capitalism, when not impeded by central authorities claiming to make managed markets work “better” than free ones do, tends towards bettering the situations of everyone. This is because free people making their own decisions in unimpeded markets is the ultimate foundation of prosperity.
There are, of course, other arguments against free markets, for example, that the more capable will take advantage of the less capable, and, additionally, that those with social privilege will leverage their position of “social” advantage to multiply their wealth at the expense of the less privileged. These criticisms are well-founded.
My rejoinder is a simple one, which is that less-managed markets are actually more equitable than “more-managed” markets, and that when economies are prosperous, there is more excess wealth which can (1) enable such social benefits as health care, education and social security; and (2) provide increasing opportunities for initially disadvantaged persons to participate in a healthy and growing economy. Social prejudices and privileges are more easily forgotten when an expanding economy creates a demand for labour.
If we have learned it nowhere else, we certainly know from the sports arena that initially disadvantaged players and teams can end up as winners when the contest is free and fair. In free markets, over time, the game is less and less about privilege, and more and more about effort, discipline and competence.
Finally, there is the problem of government debt and balanced budgets. I will not go into great detail here. I previously put forward a simple argument, that if governments STOP doing things that don't work, and do MORE of the things that work, then government actions can also contribute to a nation’s prosperity, and that can be achieved without accumulating further budget deficits.
Cooperation, Shared Goals and Accomplishing More
Humans are not the only creatures who cooperate. While cooperation is a central part of who and what we are, it's also an area of supreme difficulty for us, both as a species and as individuals. Due to our complex and wide-ranging abilities, we are very different from each other at the personal level. Our differences make cooperation powerful and growthful, but differences in our viewpoints, understandings and abilities frequently present themselves as obstacles to cooperation as well.
Much of my professional work has concerned itself with various aspects of human cooperation. I have generally worked as an advocate for cooperation, and for most all of us, increasing cooperation is a matter of overcoming obstacles of many kinds. As a general rule, successful persons either possess skills or attributes that are highly desirable to others, or they possess superior skills and have greater experience in cooperating with others.
What have I learned about human cooperation through my work? Most importantly, the obstacles to increased cooperation tend to come first from within ourselves, rather than from others. The inner obstacles are primary. The obstacles encountered in others are in most cases secondary.
Some of these obstacles include: (1) not actually knowing what we want or need from others; (2) lacking confidence that others are open to joining together with us and aiding us; (3) being fearful that others will interfere with, misunderstand, slow or impede our efforts, rather than aid us; (4) not being aware of what others may be able to offer; (5) feeling that we are alone, unimportant to others, undeserving of aid, or of inferior status; (6) feeling that only we know how to do what must be done, and that others cannot do what we believe would be required of them in a collaborative relationship; (7) lacking skill and experience in initiating and sustaining cooperation; (8) not considering cooperation with others as an option in working towards our goals, even if the goals are clear; (9) not considering that persons presently in conflict with us may be as likely to become future allies as anyone else; (10) instinctively or unconsciously ruling out certain persons or groups as possible collaborators due to pre-existing and/or possibly unknown perceptual and behavioural biases; (11) viewing potential collaborators as deficient in the skills or attitudes that we believe to be important in collaboration in general; (12) concern that collaborators will place greater demands on us than we place on them, or that their demands or expectations of us might exceed what we can offer; (13) viewing potential collaborators as unavailable because of the extent or importance of their already-existing commitments; (14) general personal limitations in the ability to set boundaries with others, that is, difficulty with establishing and maintaining the scope and limits of any collaboration.
There are many more obstacles to cooperation than the above, but this list includes some of the more common obstacles that tend to cause us to fail to initiate or request cooperation.
How then do we succeed in establishing and sustaining cooperation? I will write more about this in the near future. Some of the approaches to undertaking a collaboration and keeping it going are subtle, and are probably not obvious to most people, even though many of the methods and strategies are not actually difficult in themselves. That is, many aspects of securing others' cooperation are easy and effective, but this does not mean that they are necessarily obvious or widely known.
Paradoxes of Prosperity and Purpose | Subsistence as an Alternative
As I had stated earlier, I do not believe in any one formula which can answer every question or solve every problem, and this includes my present arguments and lines of reasoning.
For example, I have put forward a somewhat forceful argument on behalf of technological innovation and free market capitalism. While doing this, I recognize that there are real and viable alternatives to the system of capitalism and to the continuing technological innovations that capitalism tends to advance, other than the commonly proposed and now timeworn options of communism and socialism.
Briefly, my argument against the “standard” alternatives to capitalism is that (1) communism is destructive to markets, thus causing increasing poverty, and with the resulting impoverishment, accelerating centralized control, oppression, infringement of individual freedoms, and ultimately, leading to totalitarian one-party rule, etc. It’s no accident that the world’s great communist governments have also been totalitarian in practice.
My critique of (2) socialism is quite different. In fact, I was raised as a socialist, and my current view is actually that socialism is both possible and workable, under the simple condition that the institution of increasing social benefits (that is, “social infrastructure”) is predicated on a foundation of free market capitalism.
Everything I have envisioned in the current framework is hinged upon the presumption that an increasingly prosperous society will offer more and more options not only to people, but to all species with which we share our planet (“Spaceship Earth”).
To repeat, capitalist free markets spin off so much excess wealth that an increasing range of “non-profit” goals becomes both thinkable and achievable. Capitalist free markets are the cornerstone on which ever-improving “person-friendly” social infrastructure can be established.
But… and this is an important point… the real alternative to capitalism is not communism (which is anti-prosperity) or socialism (which results naturally from capitalism as wealth accumulates), but subsistence.
Perhaps the best spokesperson on behalf of subsistence was Ivan Illich, who wrote extensively on alternatives not only to capitalism, but also to socialism, industrialization, centralization, etc. Illich argued against prosperity and on behalf of simplicity.
Additionally, many of the world’s people today are still tribal people, and subsistence is the core of the way of life of tribal people. My work involves me daily with tribal people, and I am aware that their interests are more in line with a lifestyle based on sustainability than on prosperity.
There can be no question that subsistence is every bit as sustainable as capitalist prosperity, though there are obvious advantages and disadvantages to each.
A subsistence lifestyle achieves “progress” only very gradually. There might be less progress with making life easier, overcoming disease, advancing scientific knowledge, etc.
On the other hand, capitalist prosperity brings with it various demands and inevitable stresses. Mental health may be more difficult to achieve. Capitalism is competitive by its nature, and in competition, there is always winning and losing, both of which can induce stress responses in differing ways.
Many philosophers have argued convincingly against the economic system of “always more.”
Ephemeralization
To be clear, I am arguing from Buckminster Fuller’s concept of ephemeralization, that is accomplishing more and more, but with the accompanying expenditure of less and less time, money and resources. Fuller called this “doing more with less, until eventually we can do almost everything with almost nothing.”
In principle, an economy based on the technological principle of ephemeralization could, at some point in the future, make as few demands on Planet Earth as would occur if all humans had chosen a subsistence lifestyle. So even the two “real choices” – prosperity versus subsistence – could still meet again at an ultimate and common concluding destination.
Please allow me to close by acknowledging that there will never be “only one way” forward. My expectation is that the majority of the world’s people are unlikely to choose subsistence, as well as to reject prosperity with its increasingly efficient technologies, as their preferred way of life, but for those who do, it should be recognized that opting out of what I have just described here remains an entirely valid choice.
Similarly, for those who opt for the prosperity-dependent technological route, it should be understood that the aim of pursuing this course is always to go easier on our planet and its resources until we can do almost everything with almost nothing. This will probably not be apparent to most in the beginning, and the principle of ephemeralization needs to be propounded, so that it becomes, eventually, a fixture of all “prosperity thinking.”
Let me say this. For those who choose either way forward that I am suggesting, based on a mix of human freedom and cooperation, and whether with a full embrace of capitalist prosperity, free markets and the rapidly advancing technology and overflowing wealth it brings with it, or with a preference for voluntary simplicity and perhaps a contemporary version of a subsistence lifestyle, I believe there are very solid grounds to be optimistic, with both courses, as I have outlined here.
Laurence Hunt
Primary reference: R.Buckminster Fuller and Systems Theory


.jpg?ext=.jpg)
![Reactor Overview [1]-01.png](https://images.squarespace-cdn.com/content/v1/58839c83cd0f6828c5b4f4f1/1523929485656-EOAPS4VD5AEXRKZQ5QE9/ke17ZwdGBToddI8pDm48kHrc1MjerlPyvrcskIUfn8l7gQa3H78H3Y0txjaiv_0fDoOvxcdMmMKkDsyUqMSsMWxHk725yiiHCCLfrh8O1z5QHyNOqBUUEtDDsRWrJLTm4LaxnXTLZEIl_I4gL2tysgVY3WZI8G1fr8m3QW-5OeUz2HyGJsYIrucoxYXQ_z6D/Reactor+Overview+%5B1%5D-01.png?format=500w)