Wednesday, December 10, 2014

A Three Stage Gold Bull Market?

27 December 2005, 16 April & 9 May 2010; 10 December 2014

This is a legacy article from 2005 which I though might be interesting to update and republish. Here, for your interest, is the original text, followed by today's update at the end:

I was reading the most recent issue of Fortune Magazine last night, and what should be on the cover but bars of gold bullion? As you might imagine, Gold is now on Fortune’s top 25 list of recommended investments for 2006.

There is presently much discussion among precious metals analysts as to whether we have entered “stage two” of gold’s bull market, which is expected to be marked by increased mainstream interest in gold investment. I will attempt to show here, in accord with one of my mentors, Ed Bugos (http://www.goldenbar.com/
), that despite increasing public interest, we remain in “stage one” of the gold bull market, though I believe stage two is fast approaching.

Bull markets are generally presumed to evolve through three stages. In the first stage, astute individuals who are alert to emerging trends often experience considerable gains while their area of investment interest remains "under the radar."

In stage two, the general public and the professional investment community develop increasing interest in the emerging opportunities in a particular field of investment. In my understanding, stage two is typically characterized by increased risk, as a later stage pullback can erase the gains of new investors, and restore investment values to levels somewhere between the peak and the (typically lower) close of stage one. This is significant, as some early investors may sell out to new investors at or near the stage two peak, and new investors tend to become discouraged with the new bull market after a dramatic pullback has erased their gains.

Strikingly, just at the point where the general public and the broader investment community (including the majority of professional advisors) become most disillusioned with the now maturing bull market, stage three typically begins. Once again, the early investors, who have a clearly thought-through rationale for their investment preferences, are those most likely to benefit by the third, and most dramatic bull market stage, which is one of parabolic growth over a relatively short period of time.

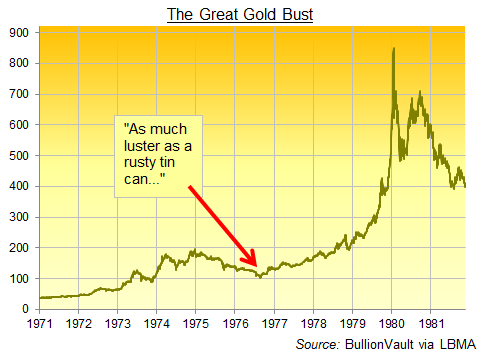
I can think of two excellent illustrations of these three bull market stages. The first is the gold bull market of the 1970’s, which ended in a dramatic 1980 peak with gold values over $800 per ounce.


NOTE: All three charts originated by Mary Ann and Pamela Aden (http://www.adenforecast.com/). Readers are advised to visit their excellent website for fuller understanding.

In stage one, gold values began drifting up from $35 per ounce, where they had been fixed by international accord through 1968. In 1971, President Nixon removed the US dollar from the gold standard, thereby fully opening up the value of gold to market pricing, which saw gold’s advance to about $120 per ounce in 1973. Stage one closed when gold pulled back modestly to about $100 later that year.

Stage two of the gold bull market was associated with the return of private ownership of gold to US citizens in 1974. The gold price moved up rapidly, almost to $200 by 1975, drawing in increasing public interest. But, as is characteristic of bull markets in their second stage, gold’s price then pulled back to the $100 per ounce range, thereby erasing the gains of new investors, but preserving the gains of the early investors.

As is typically the case in bull markets, this second stage collapse actually set the stage for the stage three parabolic move upwards in gold’s value to over $800 per ounce.

By 1980, with gold nearing its peak values, market fundamentals changed, and the wisest of investors sold their holdings of gold in recognition of the changed fundamental situation. (The best known of these is Jim Sinclair: http://www.jsmineset.com/).


The particular development in 1980 was that Paul Volcker was appointed to chair the US Federal Reserve Board. Volcker steadily raised interest rates to wrestle inflation to the floor, ushering in a 21-year secular bear market in gold. Oblivious to these fundamental changes, many members of the public were by this point anticipating near-infinite gains in the value of gold, and steadily lost their gains (or their invested capital) due to holding their investments as the gold bull market at first precipitously, and then gradually, unwound in a 21-year downtrend, ending in 2001.

My second example of a three stage bull market is the recently concluded “technology bubble.” The three stages are well-illustrated in a study of the shares of Dell Computer. Dell’s stage one accumulative phase continued through the end of 1992, at which point the price (in contemporary post-split terms) had risen from mere pennies to 78 cents a share, creating dramatic gains for early holders. However, stage one concluded with a pullback to 22 cents per share in 1993.

This laid the foundation for the stage two rise to $1.54 per share in late 1995, essentially doubling the gains of early stage one investors, and increasing the holdings of early stage two investors sixfold.

However, Dell’s share value then collapsed dramatically by over 50% to 72 cents per share that same year, essentially erasing all of the share value gains from the 1992 peak through to 1995 – a discouraging three-year period of non-performance.

This wrenching late stage two pullback, once again, set the stage for a dramatic stage three bull market move for Dell. From its 1995 low of 72 cents, Dell never looked back until 2000, at which point it had attained a value of $59.69 per share, confirming the wisdom of the longer term investors who had correctly perceived (or luckily discovered) that Dell had entered its stage three bull market phase.

Note that the shares of Dell are now unwinding, as did the value of gold after 1980, and that, in my opinion, Dell’s shares have much more to lose before its “secular” bear market is done. Dell had collapsed to the $16 range shortly after its 2000 bull market peak. It since recovered to a $42.57 high in late 2004, but in my view will be facing a long downward slope for many years to come as the investment community gradually recognizes that computer hardware has become a “commodity” in an emerging globalized economy (that is, fundamental factors have again brought an end to a dramatic and exciting bull market).

Looking back to the 1970’s gold bull market, and its subsequent 1980-2001 bear market decline, it strikes me that bear markets may be characterized by three stages as well. The bear market pullback may appear less dramatic in terms of the currency value of shares, due to the persistent eroding background interference of monetary inflation, which, by matter of government policy, steadily undermines the purchasing power of all money.

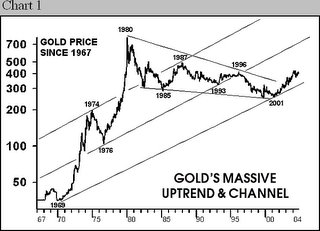
In my view, the 1980-82 gold market decline would constitute stage one of the bear market, pulling the price back inside the long-term channel of gold’s appreciating value in terms of a steadily inflating currency; then 1982-93 constituted stage two, returning the price to the middle of the channel defining gold’s value in terms of an inflating currency; and 1993-2001 constitutes stage three of the bear market, bringing the price of gold to a 21 year channel bottom, and preparing the stage for the present gold bull market.

Given that the length of gold’s recent (1980-2001) bear market was almost twice as long as its 12-year 1968-1980 bull market, I now suspect that we may be seeing a much longer and more gradual, but ultimately more powerful gold bull market than in the 1970’s.

Chart analysis shows that we have not yet attained even gold’s long-term mid-channel values (presently in the $600 per ounce range), and there is still the move to the top of the channel to anticipate (stage two), as well as a possible parabolic move above the channel to culminate stage three of the present gold bull market.

The background to my speculation that the present gold bull market will be lengthier and more powerful than the 1970’s bull market is due in large part to the fact that the value of gold mining company shares steadily weakened against the value of gold from the date of the initial free market trading of gold (1968) through 1980.

In the present gold bull market, gold mining company shares have appreciated strongly relative to the value of gold, obviously due to the fact that their relative value remains, even now, in a 36-year downtrend.


I find it difficult to countenance that the value of gold shares relative to gold will not break out of their present 36-year downtrend channel during the present gold bull market

Any breakout in share values above this channel top (we are now very near this point) will almost certainly see an end-of-stage-one pullback to the upper line of the (gold share relative value) downtrend channel, possibly on a strong move in gold, though possibly also due to short-term renewed weakness in the gold mining shares due to a range of very real fundamental issues, including inflating production costs, political risk, and questions about demand for gold at higher prices (by the way, don't worry about this latter issue – if any currency were climbing in value, would people wish to own more or less of it?).


On the upside, resistance to gold shares’ continued upward movement will be set by their 1993, 1973 and 1969 highs, respectively.) The time to sell gold shares and diversify into other investments would be at the time that the 1969 ratio high is reattained, very likely a decade or two in the future, if not longer. By then, equities, bonds or some other class of investment (perhaps real estate) would likely have returned to attractive values.

As I am working with a conceptual model which indicates that the present bull market in gold and gold shares could last much longer than the 1970’s “flash in the pan” gold bull market, I suggest that we could anticipate 20 or even 30 more years of strength in gold mining shares relative to gold. Bear in mind that only 4 years have been logged so far. Of course, there will be many surges up and down along the way. But a 20 to 30-year buy and hold strategy in gold mining shares would seem to be a workable choice in this market, even allowing for the likelihood that there will be a substantial correction at the end of stage one (if it has not already concluded), and an even greater, perhaps 50% correction, at the close of stage two.


So if we are not yet in stage two in this bull market, where are we? I suggest that we probably are moving quite near to the end of stage one, which I expect to conclude with gold values in the $600 per ounce range.

However, stage one is also likely to conclude with a greater correction in the price of gold than we have seen so far (that is, closer to a 20% - or greater - correction than to a 10% correction). The associated correction in gold shares may be more modest, and is more likely to follow the gold shares’ breakout from their 36-year downtrend than to precede that breakout move.

Psychologically, while Fortune Magazine’s cover certainly signals awakening public interest in the gold market, there remain several missing pieces to that puzzle as well. To begin, while gold itself has qualified as a recommended investment for 2006, no gold or precious metal mining companies have yet been named. Secondly, the analysis offered by Andy Serwer really neglects the primary driver of gold’s appreciation, which is ongoing inflation in the quantity of money in all of the world’s major currencies. I believe that a fundamental grasp of gold’s role as a hedge against deterioration in the value of money will need to be more clearly understood during stage two of the gold bull market.

I invite readers to share their thoughts and comments about gold’s three-stage bull market with me.

10 August 2008: Also - be sure to read my more recent posts on the topics of precious metals and secular trends, starting here: "Gold's 1980 High – Think $5000 - No $6000 - per Ounce."


16 April 2010: I thought this topic was important enough to revisit 5 years later. Though some details may be off to some degree (particularly my prediction that stage one would run no higher than $600 or so), the scenario I painted in 2005 has more or less come to pass. In my view, the 34% pullback in the gold price in October 2008 (from $1033.90 to $681.00) constituted the end of stage one in the present 3-stage gold bull market. The recovery in the gold price from this level since that time appears to constitute the early era of stage two, and that is where we are now.

Where then will stage two end? Pamela and Mary Anne Aden have recently proposed that the gold price is likely to see a level over $2000, perhaps as high as $3000, by February 2012 or so.

This prediction is based on a pattern of gold prices reaching peaks 11 years following major lows. The assumption is that a large pullback would follow that interim high - and then the fabled stage three would launch from the second primary pullback low.

Gold analysts generally expect stage three to be a "bubble" stage, during which the gold price will rise to unprecedented levels in an atmosphere of general panic. I have blogged earlier that the gold price can easily run to a level of $6000 or higher, depending on what happens with inflation, which of course now appears to be picking up steam.

As the chart above shows (comparing gold to previous well-established investment bubbles), there is no detectable "bubble" action in the price of gold at all so far, so it is not difficult to envision how the gold bull market could easily extend for an additional decade or so from here.

Speaking in broad brush terms, if stage two wraps up with a primary correction (that is, a major pullback) in say 2012 or 2013, then the stage three bubble high will occur some years after that. We are now of course speaking very speculatively. But if the Adens are correct in describing an 11-year pattern in gold price highs, then the bubble peak might possibly occur 11 years following the October 2008 low, that is, somewhere near the year 2019. This speculation thus projects that the present gold bull market will run approximately 18 years from 2001 through 2019 or so.

Interestingly, drawing on a separate source, Jim Rogers has recently reminded his followers that "previous commodity bull markets averaged about 17 to 18 years in length and experienced very large percentage increases." That is, the speculation that stage three of the present gold bull market might run approximately to the year 2019 is well-grounded in history.

If I have been wrong anywhere so far in my original 2005 speculations about the 3-stage gold bull market, it has been in my original assumption that gold stocks would begin to leverage the gold price early in the process.

In fact, gold stocks well outperformed gold from 2001-2003, and since that time (now almost 7 years), have dramatically underperformed gold itself, as can be seen in the chart above (and the HUI index is the best-performing of the alternative gold stock indices!).

If gold stock investors (I am one) can take any solace, then it is in the current positive trend in the price of gold stocks relative to gold since October 2008, as can be seen in the same chart. Should gold stocks continue their more recent pattern, then it is possible that we could see a new high in the HUI:Gold ratio by February 2012 or so. Given that gold exploration and mining companies (1) own gold in the ground at a substantial discount to the market price of gold itself, and (2) have established their ability to get it out of the ground efficiently, that would in fact be a rational outcome, though as all investors know, markets are under no requirement whatsoever to perform in a rational manner at any time!

(The photo above is of the new headframe at the Goldcorp Red Lake Gold Mine, in which my wife and I are investors.)

10 December 2014: I thought it might be worth commenting, this article has basically been proven correct, though the winding down of the stage two phase of the gold bull market has emerged as far more brutal and extended than I had imagined, even in my most recent previous post, in 2010. As it turns out, gold peaked at stage two in September 2011 at about $1930 per ounce, and there have since been four apparent bottoms, the most recent in the $1130 range in early November 2014. 


The recent bottom can be seen here (Stockcharts' daily closing gold prices are approximate):


Referring to the above article, a more extended and brutal downturn presages a stronger and longer rally back the other way (and higher) --- whenever it starts. (Timing is the most unknowable factor in the investing world, or "everybody" would win.) 

As has often been discussed here, gold mining stocks amplify the movements of gold in both directions, and the present downturn has been no exception. As you can see, gold mining stocks, as represented by the now "old hat" HUI Gold Bugs Index, have been slammed for over three years, and we're still searching for the bottom. I will just comment that this kind of (primary) correction cleans out ALL the nonbelievers, and even quite a few of the "faithful!" It has been horribly ugly and longlasting --- though, of course, that is what downturns are supposed to be, especially "primary corrections," as their function in the market is to clear out "weak hands," and thus to position holders for longer-term gains at very low entry prices. 


Even worse is the HUI:Gold ratio (the value of gold mining stocks relative to gold), as we have now revisited (and fallen slightly under) the absurdly low levels of the year 2000, prior to the beginning of the present 13-14 year gold bull market. It's as though the price of gold had not changed since the year 2000 (when it was in the $250/ounce range), though, more precisely, it's as though gold mining is no better a business at $1200 gold than it was at $250 gold 13 years ago, which is a little bit of a ludicrous concept (though mining costs have certainly sustained severe inflation during that period). 


Given how lengthy the stages of the current gold bull market have proven to be (the previous one in the 70s lasted only 8-11 years), I am now rethinking whether 2018-19 (that date is speculative guesswork, by the way) is likely to be "the top," or just another way station. For example, bonds have remained in a multi-decade bull market (which is now likely to end reasonably soon), and my present guess is that we're going to see something more like that in gold now... that is, continuing gains for decades to come, though of course, as in all markets, with surprises (both ways) and ample volatility to keep shaking out the uncommitted. 

Bear in mind, the gold price rises when real interest rates are negative, and when the global macroeconomic picture is unfavourable, due to such issues as excessive debt, monetary inflation, poor government leadership, and so on. I honestly don't see how that problem gets fixed by 2018-19. It's probably going to take much, much longer than that... and gold should sustain its appreciating trend throughout that period!

So, what can I say, but "hold on for the ride!"


_

Monday, September 08, 2014

How Long Can the Amazon.com Business Model Last?

8 September 2014

Jillian D'Onfro at Business Insider has just written a thoughtful analysis of the Amazon.com business model. If you follow e-commerce at all, then you know that Amazon plays to maximize market share, slash margins, and make customers happy.


I read this article and the reader comments carefully, because I am a core Amazon customer. I'm not into streaming media, etc., but I live in a small town in Canada where I would have to travel hundreds – or thousands – of miles to find even slightly specialized items. 30-40 years ago, I was ordering odds and ends at the local small-town Sears outlet (we still have one). But Amazon is for sure the new Sears if you live in a small town.

Now I honestly don't see how Amazon can stay a going concern based on its present policies, but everything they do is by all means customer friendly. I have the Amazon card, etc. (No need for Prime, however, which isn't so great in Canada, anyway).


Let me share just one example of a surely non-sustainable business practice. I basically outfitted my home gym at Amazon (though I bought my weight sets years ago, in Winnipeg, about 150 miles away). So, I order a Ringside 100-pound heavy bag from Amazon.ca for maybe $139, and the shipping is listed at maybe $270, but it's eligible for free super saver shipping. I mean, the delivery guys had to haul it to my house and bring it up the stairs to my door (something I would have had to do if I'd made the purchase at a store). So for no shipping charge, I have this 100-pound bag waiting for me at my door.


Logic insists that this cannot last. But yes, I am trying to buy everything I could possibly ever need now, because I can't see Amazon still delivering hundred-pound packages for free, 5 or 10 years down the road! But for consumers, there has been nothing better.

And, to do a business analysis, Amazon clearly has one competitive advantage, which is the massive number of partners. (The local competitor is Indigo.com, which is a home-grown Canadian former bookstore chain turned e-tailer, but, “no competition.”)

In recent years, it has indeed gotten easier to search Amazon than Google, if the intention is to make a purchase. Given that AMZN has a massive market cap, and Sears is on death's door, it has crossed my mind that Amazon might want to buy up Sears just to get their distribution system, and the Kenmore brand name may or may not help --- not that important. But if I had to drive the one-mile trip to the Sears distribution centre to pick up my Amazon order (still with free shipping), I would not be complaining. 


This advantage really shows up in Canada, where, historically, no retailer has ever given any customer anything for free. Canadians are used to paying top dollar for services in most categories, and that included shipping, until Amazon.ca showed up. (Sears usually had the best delivery deal, before Amazon arrived on the scene – but they would not deliver a 100-pound item to your door for free --- you still had to go to the outlet yourself, and pick up the new washer and dryer, snowblower, or what have you, possibly with the van you had borrowed from your neighbour!)

So, I certainly wish Amazon well, but I'm buying all the heavy stuff now!
_

Monday, September 01, 2014

Patiently Awaiting Recession Number Three

1 September 2014

I have posted before that the US government, in my opinion, doesn't manage money very well. These charts are meant to serve as one illustration of that.


Basically, "reserve bank credit" is new money printed by the Federal Reserve Bank to keep the economy moving along when things slow down (most notably after 2000 and 2008, but it's actually been going on for a long time on a smaller scale).

One interesting factoid, the total US (broad) money supply as recently as the year 2000 was less (about $2.8 trillion) than just the Fed's balance sheet today (about $4.4 trillion).

Fed injections of "new money" (a euphemism for money-printing) have brought the current US money supply up to the $10 trillion range.


So, if you're not feeling 250% richer, that is probably because money-printing mainly just causes inflation.

The official statistics show inflation as "low," but as they say, it's easy to lie with statistics. If you have noticed necessities, in particular, getting more expensive, it might have a lot to do with the antics of the Federal Reserve.

Does money-printing solve anything? No, it actually makes things worse, by encouraging short-term thinking, and by giving more options to the ultra-rich (who are able to play games with money) than to anyone else.

As soon as all this stops, the economy will slow down --- again, and a lot.

That won't be fun, but it will cause people to start making longer-term and better decisions.

The Federal Reserve may not be permitted to do this a third time, as people may eventually figure out that economies improve through capital investment (based on having a real business plan and confidence in the future), rather than through running the (now-digital) printing presses.
_

Friday, August 29, 2014

THE BEST DECADE I HAVE SEEN

29 August 2014
Having lived in parts of three half-centuries and 8 decades, I believe I am qualified to comment on this topic. Of the decades through which I have lived (starting with the '40s), the best (by far) was the 1950s. No other decade compares.

Don't get me wrong, there was a lot wrong with the '50s. Basically, everybody smoked, drinking to excess was widely accepted - as was drinking and driving, food quality in supermarkets was actually at a low ebb during that decade. There was a fascination with science and technology, and canned and processed foods, many with virtually all nutritional components removed, were staples of the diet. Previously unknown metabolic diseases were on the increase. Above-ground atomic testing was still going on, poisoning the air and soil. Worse still, racism and xenophobia abounded, and no less than 10% of GDP, possibly much more, was "100% wasted" on "anti-communism" (a problem which the communists themselves corrected by creating social and political structures that imploded). Paranoia was pervasive, and social and political norms were incredibly narrow.
That said, essentially all the problems I just listed started getting better in the 1950s. It was the key decade, above all others, in which the middle class prospered. Increasingly liberal social policies worked, because the group of socially disadvantaged persons was small enough that a modest diversion of funds and efforts could genuinely help them. The poor gradually began to move into the burgeoning middle classes. Antibiotics and vaccines came to be widely used, creating a revolution in public health. And doctors still made house calls. There were no class action lawsuits, drug abuse existed only at the fringes of society, and people thought that new technologies and new products were "good." We even initiated the space race in the 50s, and Chuck Yeager had already broken the sound barrier (that was in 1947 --- I remember sonic booms throughout my childhood).
While many of the problems of the '50s have been corrected today, the great majority of its advantages have been lost, foremost among them, the dominance and prosperity of the middle class, and with it, the conviction that advances in society and science were going to keep making life better. While we no longer waste taxpayer dollars on military adventures against communism, our efforts to oppose Middle East dictators (and renewed Russian expansionism, of all things) are equally counterproductive and ill-advised. It's the Chinese who are going to "beat" us anyway, and they are presently doing more things "right" than we are, so I can't really say I'm against them... though my preference would certainly be for us to do better, as our society is freer and more tolerant than theirs.


I remain optimistic at heart. I am always thinking about how things can be better, and the range of our opportunities remains unimaginable. But we are presently mired in ideological straitjackets that no longer match our present reality, a very large proportion of our taxpayer dollars are invested in counterproductive ventures that are more likely to bring pain and further social disintegration than satisfaction, and we have new social problems that make those of the '50s look infinitesimal by comparison. We are quibbling over the small stuff, and failing to invest in and plan for "the big stuff."
Technologies that have the potential to resolve most of our present problems (robotics, nuclear fusion, space habitation, biotechnology and many more) await us on the horizon, but we aren't even going that direction. In an effort to please everybody, our elected leaders are investing in old ideas that don't work, accumulating debts that cannot be repaid, and laying the foundations for increased social and economic disorder in the future.
I guess I'm just arguing that it's time to think smarter and make the hard decisions. Why do I believe we can? Because that's exactly what we did in the '50s. Let's start by believing that new ideas (not just old ones) can actually make things better. That in itself should be enough to turn the tide.
_

Saturday, January 18, 2014

A Best-Case Scenario for the Financial Apocalypse

18 January, 18 February, 2 April 2014

Let's try the "best-case" scenario for where the US economy can go in the next several years. 


In our current "Fed-centric" economic environment, our first assumption must be that the Federal Reserve ("the Fed") will be able to keep tapering its purchases of US bonds and mortgage assets with never-before-existing money, and that nothing crashes. 

Fed total asset holdings rose from $3 to $4 trillion in 2013. These assets consist of mixed US bonds and mortgage "securities." With tapering, the Fed is now buying $75 billion in new assets per month, down from $85 billion per month last year. So by the end of this year, their holdings will still be close to $5 trillion. In fact, lets say that they decide they can taper another $10-20 billion per month (we're being optimistic here), so maybe in 2015, they're buying $50 billion a month. Even with a good rate of tapering, they're still going to end up holding something in the $7 trillion range in 3-5 years. 


So now, think about how that would impact the budget line if the government and mortgage agencies started paying the Fed back (that is, the US government would need to dig into its own or somebody else's pockets to find another $7 trillion, plus accrued interest, in addition to its current expenditures). Note that China holds $1.3 T, Japan $1.2 T, and all foreign nations $5.7 T in US government bonds.) OK. Let's NOT pay the Fed back, then. We can keep rolling that over. The Fed (truly) doesn't care, since they are legally permitted to print Monopoly money whenever they wish to.


Current US GDP is $16 trillion. US total (Federal only) debt is $17.3 T ($54,000 per citizen). The present blended rate of interest is 2.4%, requiring $415 B per year to pay interest on the current debt (and the Fed already returns its portion of interest due). The foreign holders ($5.7 T) obviously want to collect their payments more than does the Fed. Same for the domestic holders. However, the average rate of interest over the past 20 years was 5.7 %, and 30-year treasuries are presently at 3.76% (up from 2.4% in 2012). Remember that operation TWIST transferred as many long-dated assets as possible into the Fed's hands (figure that one out - OK, I'll help you: Fed purchases of 30-year treasuries keep rates lower through artificially-induced "demand" for this expensive-to-repay product). 

The US annual deficit is now back to a "low" $680 B (down from $1.1-1.4 T in the preceding 4 years). Increased tax receipts accounted for 79% of the reduction from the previous year's $1.1 T. Though this is "better," this is only temporarily the case (see below). And, no matter how good it gets, the US national debt will still exceed $20 T in a small number of years. 

Now, let's apply historically normal 5.7% interest rates to $20 T in debt. Yes, you calculated correctly. The annual debt service reaches $1.14 T. How much does the IRS collect in taxes? The last year for which we have figures is 2012. In that year, tax receipts were $1.1 T. I think you can see where we're going. In a "normal" interest rate scenario, tax receipts will cover interest payments on the national debt and nothing else. 

Bear in mind that in our best-case scenario, the annual deficit may continue to fall, though perhaps only for a short time. The Congressional Budget Office projects that the annual deficit will decline into 2015, to under $500 B, but then will start rising again, due to mushrooming entitlement spending - note that no one anywhere denies this. Remember that so long as the government keeps running deficits, the national debt will continue to increase, thereby placing additional pressure on interest payments. 

While interest rates may stay artificially low for a while longer, I think the chart below illustrates reasonably well why a return to the 5% range is likely. There are those who think that 2008-2012 was a "double bottom" in these charts. Economists pay A LOT of attention to interest rate trends, as they exert a multifaceted influence on behaviour, including borrowing, spending, investment and, of course, the flow of credit. In particular, when consumers pay higher interest rates on debt, they make fewer purchases. 


Note that 10 and 30-year interest rates are set by the market, NOT by the central planners (foremost among them, the Fed), and that the central planners are presently proposing to intervene somewhat less in "the market." Also consider that real inflation rates are substantially higher than the central planners are telling us (here, take your soma, you'll feel fine). Finally, note that entitlement spending has been "on the rise" for 45 years.


The "conservative" CBO sees future expenses looking like this (they always lowball everything, don't they?):


Note that non-entitlement spending actually has to fall to make the above chart possible. 

So at present, we are apparently in what I can only call a transitional period, during which some old ways of picturing our situation (collect taxes, pay bills, run up a tab, keep rates low) will have to give way to some new ways of thinking (OMG, we can't afford this!). 

Tipping points are hard to predict in advance. But how can one argue that a tipping point does not lie ahead? 

While the bills can obviously be paid with inflated dollars, can this be done without the costs of everything else (including entitlements) also rising? 

So, it seems to me a question of "when" vs "if." Have I argued wrongly anywhere?


Remember, I have just described the "best" case for how things can play out. 

Because the economy is a complex system, it is difficult to visualize all of its moving parts at one time. It may help to think of it this way. The fundamental problem is very simple: We are spending money we do not have. However, that "game" can play out in many different ways. When we did the same thing in the 1920s, the result was the Great Depression of the 1930s, as the financial dislocations were allowed to work their way through the system, and most of the fundamental problems were eventually corrected by the market itself. That is, the most viable businesses survived, and the economy became more productive and efficient through the process that Joseph Schumpeter called "creative destruction."


Our present generation has been playing more by the rule of "you can have it all." Well, here is how that works. In 2008, a partial withdrawal of financial stimulus by the central planners led to the inability of vulnerable borrowers to make payments on low-quality loans. The infection then spread to middle and upper middle class borrowers as well, and asset values (primarily home prices) collapsed, causing recent home buyers to go "underwater" on their mortgage loans, despite the fact that the loans were originated at very low interest rates. A similar, though more restricted process had occurred in 2000, with the bursting of "the tech bubble" (which was also caused by monetary inflation promulgated by the Fed, but that is not today's topic!).

The Fed responded to the bursting of the housing bubble in late 2007, which led in turn to the financial "crisis" of 2008-2009, with historically-unprecedented measures, including lowering interest rates to well-below the level of inflation, and the initiation of massive purchases of US government bonds and mortgage securities with newly-created money, thereby greatly expanding the total supply of US dollars in circulation, and buoying the faltering (and overbuilt) housing market. The government, for its part, took an ownership stake in badly-run businesses, such as General Motors and Bank of America, preventing them from failing (Lehman Brothers was the canary in the coalmine, and didn't get rescued).


I think what the above discussion illustrates is that it has proven possible to "solve" one problem temporarily by creating another. As a result of spending literally trillions of dollars to bail out mismanaged companies, to restore owners of mispriced homes to solvency, and to keep the economy ticking, the US government chose to take on historically-unprecedented levels of debt, which it has so far been able to manage through its partnership with the Fed, which has kept interest rates extraordinarily low. As a consequence of continued artificially-low interest rates, government debt payments have remained "manageable," despite the explosion of the absolute amount of the national debt. About $8 trillion was added to the national debt in little more than 5 years, between 2008 and 2013, in order to "solve" the problem of the collapse of the housing market together with the consumer economy.

Today, the US stock market is at new highs, and there is universal optimism that the economy is "in recovery," while not so far beneath the surface, the US national government has run up a level of debt never before seen in history, which it has absolutely no means to repay. Concurrently, the US government faces increased entitlement and other expenditures which are expected to "explode" into the far future, beginning in about 2015. A national debt amount of $5.7 trillion on September 30, 2000 has literally tripled to a figure of $17,270,240,354,364.86 today (official figure as of January 16, 2014).

That is, the US presently owes about one-third of all the government debt in the world (total global government debt presently equals $52.5 trillion dollars). As American citizens represent only 4.5% of world population, the average American citizen bears a (government) debt load equivalent to ten times that of remaining global citizens ($53,600 average government debt per US citizen, versus $5,220 average government debt for all other global citizens).

So, in brief, our current "you can have it all" generation has persisted in "solving problems by creating new ones." Rather than face the current financial collapse as we did in the 1930s, by allowing it to run its course, Americans have opted instead to take on unsustainable levels of government debt in order to keep the economy "humming." Of course, the rising debt amounts must either be repaid or inflated away. Neither course is particularly attractive, and both options entail future economic weakness in return for the illusion of economic wellbeing today.

Beneath the surface, the real problem with the current "rescue strategy" of the central planners is that "patchwork" solutions of the type I have described promote what the Austrian economists refer to as "malinvestment." Malinvestment is an almost invisible, but pervasive problem that is only exacerbated by "quick-fix" strategies.

That is, when the economy is merely limping along, wholly dependent on injections of "stimulus" (a euphemism which simply and always means "increased debt"), and with no fundamental factors to justify expectations of real improvement over the long term, business investors simply lack the confidence required to commit their available monies to long-term projects of good quality. They instead divert their investment funds to often-insubstantial, quick-return schemes - for example, the "subprime loan business" of the early 2000s, and the expense reductions, middle-management layoffs and Wall Street game-playing seen everywhere today.

So yes, we can solve one problem by creating another. That is how systems work. But doing this further impairs the functioning of the total system each time that "problem displacement" occurs. So let us now return to our fundamental and very simple problem: spending money we do not have.

How does one actually go about fixing a problem of this kind? The "real fix" for our present predicament is to make the tough decisions about what we must have and what we can do without. My personal belief is that, due to advances in technology and other factors, we truly have the means for all of us to live reasonably well today (though not like kings and queens) if we make some tough decisions.

First among these "tough decisions" is for the people themselves to wake up to the fundamental problem, which is that we can have a good life - caring well for each other, including for the weakest and most vulnerable members of society - but we cannot "have it all."

In my view, there is a lot that we can do without, and I have blogged about this before. I'm confident that we can dispense with our current fixations on the use of police powers and prisons to solve social problems, on military power to solve international problems, on hyper-regulation to limit the "unpredictability" of free markets, and on zero-sum game-playing in many spheres, for example, our current fixation with lawsuits and litigation of all kinds (vs. cooperative problem-solving).

Secondly, all of us, in my opinion, need to engage in much more long-term thinking. We must make some tough collective decisions about the carrying capacity of our planet's natural systems, which are overloaded and failing. We will benefit by making much bigger (not smaller) investments in technologies which promise a better life far into the future, including, in my view, such projects as basic and applied science, education, physical and social infrastructure (including health care and health promotion), fusion energy, robotics, space exploration, etc.

Finally, our political leaders need to have the courage to stand up for long-term versus short-term thinking, and to take the risk of engaging in politically unpopular decisions that hold promise for a truly better future, rather than just muddling through, following rather than leading us, on a day-to-day basis.

Do I have any advice to offer? 

A little bit, yes. I'm reasonably confident in stating that over 50% of current government expenditures in most global jurisdictions (not only in the United States) can be classed as "waste." I have blogged about this previously - and I'm not talking about any expenditures that directly help people or which preserve or expand infrastructure or the practice and application of science and "appropriate" technology. We could also spend more profitably in selected areas, first among these, on science education and on basic and applied scientific research (as discussed above). 

Finally, for investors, history teaches us that in times such as our own - until we "get our act together" and begin to address the fundamental problems we face - gold remains an asset that will preserve value when monetary inflation (a consequence of solving our immediate economic problems by expanding debt) eats away at the market value of virtually everything else. So, yes, keeping your savings in gold or gold-linked assets is still a very, very good idea, in my opinion. I have blogged about this dozens of times, and you may read as little or as much about this as you wish.

If perhaps it seems paradoxical that I am here advocating massively greater societal investments in science and technology, yet advising individuals to invest their personal funds conservatively in gold and gold-linked assets, I can offer an explanation. 

As we have been discussing, the present investment climate is not only unsustainable, but precarious. In fact, my real argument in this post has been that we are at present woefully underinvested in such necessary areas as education, social development, and science and technology precisely because we are making very bad social and economic decisions at the systemic level. In such an environment, investments in even the "best" scientific and technological ideas are at risk of failing, due to the absence of a viable and resilient systemic framework to support and sustain them. 

That is, we have got to reform our social, political and economic systems so as to make possible an environment in which scientific and technological investments can play out successfully over a longer term. I look forward to the day when I can proclaim that it is finally "safe" to invest in "good ideas." Believe me, this is my ultimate objective. 

Precious metal investments are literally a "crisis strategy" for dangerous times, and nothing more than that. Paradoxically, the greater part of the present danger has been created by well-intentioned, academically-sanctioned planners who believe that they can effectively "manage" our problems by centralizing control of the economy, and by riding through every rough patch by taking on more debt.  

I hope that what I have shown today is that this type of central planning, with its reflexive reliance upon the accumulation of debt and the suppression of long-term entrepreneurial initiative, rather than being a cure for what ails us, is actually the primary cause of our predicament. 

I eagerly await the day when the central planners and debt-advocates will take leave from their posts (in all likelihood, due to the catastrophic failure of their policies - though I emphasize that a voluntary change in direction, or failing that, resignation, would be preferable). At such a time as this, it will then be entirely timely for the rest of us to take action to create - and invest in - a better future for all in a once-again market-driven economy, which, if we choose, can be socially-sensitive as well. 

(While I believe that market-driven economies can also be socially-sensitive ones, that, too, is a topic for another day. Centrally-planned economies - including our own at this time, despite their socially-focused ideologies, are typically the least socially-sensitive of all. That is, they are riddled with paradox and counterproductivity because they discount the irreplaceable value of unimpeded choice as exercised by free citizens. If you doubt me on this, please consult the records of Josef Stalin, Robert Mugabe, Hugo Chavez, Osama bin Laden and other well-known central planners. But that is another topic!)

(Artwork by Brenda Brolly.)

18 February 2014: Some thoughts of the day.... Let's try arguing for inflationary policy for a minute. In truth, the $3 trillion (so far) won't have to be paid back. Also, only the Eurozone (including Iceland) is refraining from all-out inflationary policy. That is, everybody else is doing it, too - the Chinese, Japanese, Latin Americans and Africans in spades, for example - even the historically conservative Swiss! Asian manufacturers are keeping costs of goods relatively low, which helps to tame the inflation numbers, though service costs are rising, often dramatically, and the costs to produce anything are going through the roof (mining costs have gone crazy). Analytically, the real problem with inflationary policy (when everybody is doing it) is "malinvestment." That is, the money gets spent differently than when investment is based on savings, and there is no incentive to tame the bureaucracy and the military-industrial and prison-police complexes. So we can "afford" to keep doing all the things we really shouldn't be, including "throwing" money around, over-regulating almost everything, surveilling our citizens and locking a lot of people up for bad reasons. Thus, the problems with inflationary policy aren't obvious, and it looks good on the surface, but it's kind of "rotten" underneath... and that creates low quality new jobs, etc. When you reward savers, you have to stop doing inefficient and counterproductive activities, but the money is spent on long-term projects that are attractive to investors (who are real and usually prudent people), vs get-rich-quick schemes (just look at Wall Street these days, the proliferation of casinos, etc.). Obviously, I have trouble sticking with the pro-inflation side for long, for these reasons!

2 April 2014: Current thinking is that financial tapering can now happen faster, as things still look "OK." My take is that things are not actually OK, when we look beneath the surface. But, let's say tapering happens faster, anyway. The main implication is that the slowdown in money supply expansion then also happens faster. That is, we're slamming harder on the brakes (though bear in mind, we're still "speeding" by a considerable margin). If you look at recent history, the Fed has tried that a few times before, and always with undesired results. And following each intentional slowdown, even more "gas" has been required to get the motor revving again. I'm open to all possibilities, but when I look under the hood, I don't see how you can slow the rate of stimulus and still play the pretend "growth" game. So, let's wait and watch, and see how the fundamentals play out. My guess is that something will happen along the way that will shock the Fed back into "super-easy" policies, as that has been all the speculation-driven markets will accept, really, since 1987....
_

Gold's 1980 High – Think $5000 – No $9000 – per Ounce – or Higher

15 July 2007 - Updated 18 July 2007, 6 & 10 April & 29 July 2008, 13 & 18 November 2009, 18 January 2010, 13 & 31 January, 15 February & 15 May 2011, 22 April 2012; 20 January, 22 February & 14 July 2013; 18 January 2014

The following article was originally published on July 15, 2007, so please read this as a historic document. More recent comments are added at the conclusion of the original post.

Jay Taylor has just posted a new inflation-adjusted estimate of gold's peak 1980 price.

As readers of this blog are aware, the price of gold rises in inflationary times.

Readers will also be aware that governments purposely and systematically understate the amount of actual inflation so as to make it possible for debtors everywhere – and governments are the greatest of all debtors – to repay obligations in a devalued currency, thereby enabling the ongoing operations of a debt and liquidity-based economy.

As a reader, you will also be aware that such an economic strategy punishes savers and rewards debtors by making saving unprofitable, thereby fuelling borrowing, discouraging saving, and creating asset bubbles (government sanctioned Ponzi schemes, if you will).

(Inflating asset bubbles entice citizens who would otherwise be savers to invest their devaluing cash in risky assets, thereby creating economic instability as an inevitable correlate of monetary inflation.)

The US government's official figures acknowledge that 1980's peak gold price was not the nominal $887.50 intraday high figure that those of us old enough to remember can recall from that era, but an estimated $1,459.63 US dollars.

Given this figure, we could conservatively expect gold to revisit a price near $1500 per ounce at some point in the upcoming years, based on cyclical fluctuation alone.

However, Mr. Taylor reminds us that the government inflation estimate is in fact grossly understated. According to him, Boston-based money manager Antony Herrey has compiled a chart of the inflation-adjusted gold price using not the government's own CPI statistics, but rather much more accurate inflation numbers compiled by economist John Williams.

Mr. Williams estimates that today’s US inflation rate is closer to 10% than the official (and entirely non-believable) government-reported 2.7%.

Mr. Herrey’s readjustment of the historic gold price based on the actual (non-manipulated, if you will) rate of inflation shows that gold in fact peaked at an inflation-adjusted amount of about $5000 in 1980.

The implication of this recalculation is that by normal cyclical fluctuation alone, it is reasonable to expect the current gold bull market to top out somewhere higher than $5000 per ounce.

Why higher than $5000 per ounce?

Because inflation will continue as the gold price rises.

So at today’s $666.00 per ounce, is gold cheap or expensive?

I think you can figure that one out.

On my advice, do not invest your devaluing cash in the current stock market and real estate bubbles (or other risky assets) presently exciting North America and much of the developed and developing world, but preserve your savings through the time-honoured store of value offered by precious metals – gold and silver.

Gold is up 150% from its 2001 low. But it can grow a further 750% from today’s levels – in real cash terms – before equalling its inflation-adjusted 1980 peak value.

This dollar-value advance would represent a 2000% or more (non-inflation-adjusted) cash gain from the 2001 low near $250.

Another way to think of it is that in true 1980 dollars, gold’s current market price is not $666.00 per ounce, but a reverse inflation-adjusted $113.00 (1980) US dollars per ounce.

The stock market by and large is trading in bubble territory by historic metrics. Real estate in many North American locations is also in bubble territory. Citizens everywhere are borrowing at a record clip and pouring their savings into ever-riskier assets – with today’s fads being hyper-leveraged hedge funds and the privatization of public companies by pension plans and private equity groups.

Do not let official government inflation policies force you into risky assets to preserve or increase the value of your savings.

While asset bubbles are over-valued by definition, gold remains radically undervalued, and will be a secure store of wealth for many years to come.

It is not that the price of gold is rising. It is that we are re-evaluating the worth of gold in terms of the declining value of “paper” (or digital) money.

Governments around the world can create new money through a series of computer key strokes.

But until the alchemists succeed – or until nuclear fusion advances far beyond today’s levels of sophistication – so that we can create gold at will from “base substances” – gold and silver will remain stores of value that are essentially impervious to the irresponsible inflationary policies of our governments around the world.

By the way, commodities generally also look very cheap today in inflation-adjusted terms, despite doubling on a broad measure since 2001. The chart below, from Puru Saxena, graphs commodity prices from 1954 through February of this year, with the inflation adjustment based only on the US government's profoundly muted official inflation numbers.

The Reuters/CRB continuous futures commodity index peaked in 1973 at $1048 in nominal "2007 US dollars." If we are to believe John Williams' inflation numbers, the real 1973 commodity index peak would have been in the $3-4000 range in 2007 US dollars. Today's CRB continuous futures index amount – just above $400 – therefore looks very much like a bargain from that perspective – and signals that commodity prices will run much higher before the world's demand for commodities has been sated.

Addendum - 6 & 10 April 2008: This post is the most frequently visited on my site, so I have added links to related information here, where more visitors are likely to find it. Mr Williams has recently updated his inflation-adjusted 1980 gold price to $6030, in order to reflect recent further inflation of the battered US dollar, which, as you know, is unwinding quickly at this time. Click here for more current information.

If you're looking for current gold prices - right up to the minute, visit Kitco.com. Kitco also has a wide selection of historical charts dating back as far as 1792. Kitco also sells gold in various forms, and can hold it for you, with delivery at a later date - allowing multiple purchases over time with only a single delivery charge.

And if it's technical charts you need, go to Stockcharts.com, though these charts date back only to 1990.

For further study of associated underlying factors, such as accumulating debt and escalating money supply, click here.

For more information about Canadian gold investing, click here.

For information about secular trends, click here.

For information on investment issues that relate to gold mining, click here.

For links to precious metal investment advisories, please view my links section to the right.

Could the price of gold rise higher than $6000? Click here for some speculations about a $9000 or higher gold price.

How should gold be priced today? My October 2008 estimate is in the $1600 range. Click here for this article. Bear in mind that "should" and "is" are two different ideas....

13 November 2009: Like the idea of $5000 gold? I'll be honest with you, any estimate of numbers even a few years in the future depends on countless economic unknowables, including the level of fiscal responsibility of all governments around the world (don't get overly optimistic), cumulative global central bank monetary policy, issues of war and peace, free or impeded trade, etc. So who really knows? Not I.

But here is an unlikely person who likes the $5000 number: Martin Armstrong, a financial theorist, former hedge fund manager and convicted Ponzi schemer (see Wikipedia entry here), likes the $5000 number for the year 2016. I can't tell you much about wave theory, not do I have personal knowledge of Mr. Armstrong's character, but I can attest that his fundamental analysis is not entirely off the mark. He states: "Gold has been among the most hated subjects by the socialists, because with each dollar that it advances, it reveals the delusion that they seek to live within."

However, in my view, Mr. Armstrong's critique, with its focus on the shortcomings of socialism, goes nowhere near far enough.

In correction to Mr. Armstrong, who makes a distinctly partisan argument, let me add that in my view, the fundamental problem is hardly with "the socialists" alone - as this group certainly remain a minority faction in North America and through most of the developed world. Particularly here in North America, it is unlikely that it will be the socialists who do us in....

Basically, every party and faction that seeks to resolve its issues through government rescue of a particular sector of the economy is equally in trouble, and that goes for the belligerent folks at the military-industrial complex, the Wall Street speculators who live for the next government guarantee, policy easing or bailout, the CEOs and executives who award themselves and their cronies obscene salaries and bonuses, the elected representatives who vote themselves comfortable pensions, and the financially reckless at all levels and strata of society from the poorest to the very rich.

Transferring funds from one sector of society to another sector of society through government intervention, exploiting savers and investors to pay off executives and managers, borrowing money we do not have and cannot pay back, billing our present expenses to future generations, and printing money out of thin air, are not sustainable strategies for wealth creation (though all are widely practiced today).

In fact, permit me to restate Mr. Armstrong's words as follows: "Gold has been among the most hated subjects by the financially irresponsible at all levels and in every sector of society, because with each dollar that it advances, it reveals the delusion that they seek to live within."

You heard it here. This is not about socialists. It is about all of us. Let's get our act together and start balancing budgets, promoting savings and investment rather than spending and borrowing, and setting aside reserves for the future rather than bilking our trading partners, shortchanging the purchasers of government bonds, and robbing our children and grandchildren.

I'll say it another way, let's make life easy for savers and investors, and difficult for borrowers and spenders. For a start, let's raise interest rates, not lower interest rates. Rather than taxing those who save, let's subsidize - or at least get out of the way of - private investment in legal and ethical business ventures of all kinds by those who set aside a portion of their funds for other than immediate uses.

That being said, Mr. Armstrong's select monograph on $5000 gold can be found here, courtesy of The Business Insider. Think what you like about his personality or his ethics (I do not condone securities fraud!). But Mr. Armstrong might possibly be on the right side of the trade when it comes to setting future gold price targets.

(More theoretical and critical articles by Mr. Armstrong can be found here.)

18 November 2009: Depending on your preferences, here is another analyst calling for $5000 gold. This time around it's Marc Faber, the Swiss-born trader who has resided in Asia for many years. Mr. Faber is arguing that gold is a better buy now, at over $1100 per ounce, than when it traded at $300 per ounce 6-8 years ago.

Faber states:

"I don’t think that you’ll see gold below $1,000 per ounce probably ever again. So I’m quite positive. Maybe, gold at this level is a better buy than it was at $300 per ounce in 2001.
"At first glance, the idea that gold priced at over $1,100 an ounce is 'a better buy' than when the metal traded at about a quarter of that price seems preposterous. But, when you think about it just a little bit (i.e., what constitutes a 'better buy' and how the fundamental factors have now swung so decidedly in gold's favour), maybe it isn't a crazy idea at all.


"I wouldn't be surprised if, in another eight years - in 2017 - the yellow metal fetches $5,000 an ounce or more which, by my math, would make it a better buy. Gold may not rise as much against other currencies, but, after almost a decade of trillion dollar deficits, that almost seems like a slam dunk when the measuring stick is the U.S. dollar."


-----------

Lots of talk right now about longer-term gold targets. Of course, gold can go to infinity if the US dollar loses all of its value. I'm not predicting that, but the losses in the dollar are striking over the scale of the past century (during which the Federal Reserve has had a license to print money).

Dylan Grice, at Societe General, sets a target of $6300 per ounce. I think he is in the ballpark, though his methodology doesn't make sense to me. He is working out how much gold the US has, and what the price of gold would have to be to back every US dollar in existence. Here's the problem - the US government is not going to give anyone gold on demand in exchange for its currency.

Nonetheless, here is Rolfe Winkler's take on Grice's idea.


-----------

The $5000 figure is now popular. Martin Hutchinson, a market historian writing at Prudent Bear, observes, "The opportunity for the world's central banks to change policy and affect the economic outcome has been lost. The world economy is now locked on to an undeviating track towards another train wreck."


What is Mr. Hutchinson's gold price target? Again, $5000.

An esteemed historian in his own right, Adrian Ash explains: "Hutchinson sees a repeat of 1978-1980 now unfolding, with the price of gold vaulting to perhaps $5000 an ounce by the end of next year."

This rate of development of the crisis is a little fast for me....

Mr. Hutchinson sees it like this, however, "If expansionary monetary and fiscal policies are pursued regardless of market signals, the US will head towards Weimar-style trillion-percent inflation... As I said, a train wreck. Probability of arrival: close to 100%. Time of arrival: around the end of 2010, or possibly a bit earlier. And, at this stage, there's very little anyone can do about it; the definitive rise of gold above $1,000 marked the point of no return."

Mr. Ash does not oppose or endorse Mr. Hutchinson's one-year $5000 projection for the gold price, but he concludes, "In short, if you think buying now feels a hard decision, what would you think 50% or 100% higher from here....?"

You know, that's worth thinking about! Click here for Adrian Ash's full article at Seeking Alpha.

18 January 2010: More articles on $5000 gold:

"The Five Reasons Gold Will Hit $5,000"

"Gold May Rise to $5,000 on Inflation, Schroder Says"

"Peter Schiff makes the case for $5000 gold"

"Will Gold Reach $5000 an Ounce?"

"$5,000 Gold?"

"$5,000 Gold In The Future?"

"Could $5,000 gold be too low as dollar loses value?"

"Global Stock Market Forecasts - Shanghai Index 30,000, Gold $5000 and DJIA 17,000"

9 May 2010: Gold's next stop = $3000 per ounce in 2012?

Maybe - click here.
(Gold Decouples on International Debt Crisis Concerns - Gold Forecast to Reach $3,000)


Mary Ann and Pamela Aden are also currently considering a 2012 peak target in this range, and suggest that a subsequent peak in 2018-2019 could be several thousand dollars higher.

Enjoy!

13 January 2011: Today is my father's birthday, so I dedicate this post to him.... There is now so much material on this topic, I hardly know where to direct you. But for an overview, one diligent researcher has gone to the trouble of tracking down every known gold price prediction (and here I'm discounting those looking for $680 gold in 2014. That is NOT going to happen through any conceivable course of events - apart from the synthesis of gold in a fusion reactor or the earth's collision with a golden asteroid!).

Click here for Lorimer Wilson's unique overview: These 110 Analysts Believe Gold Will Go Parabolic to $3,000 or More! (The link may be somewhat circular, as the present article is also mentioned.) Mr. Wilson's article may be of special interest if there are particular analysts that you prefer to follow.

31 January 2011: Here is an up-to-the-minute gold price estimate - following Alan Greenspan's recent recommendation that we reconsider a gold standard. The US gold hoard - the largest in the world - will back the entire US money supply at a rate of $6300 per ounce. It sounds arbitrary, but if the US were to adopt a true gold standard (every dollar in circulation backed by non-printable, non-inflatable physical gold), that's how many dollars is would take to purchase a single ounce of US gold holdings..... Note that Mr Greenspan joins Robert Zoellick of the World Bank, Howard Buffett (but not his son Warren), Jim Grant and Thomas Hoenig of the Kansas City Fed in making this recommendation. Think about it... a gold standard for our ever-inflating money supply, and $6300 gold.

15 February 2011: The current SGS (Shadowstats) inflation-adjusted price for gold's previous 1980 peak value (based on gold's $850 close vs. its $887.50 peak intraday price) is now... get this, $7824 per troy ounce (courtesy of The Dollar Vigilante). And, of course, as inflation increases towards, let us say 2019, we are likely to move above not only an $8000 figure, but quite realistically, a $10,000 figure as well. Caveat: If Ron Paul can tame the Federal Reserve, this could all evolve differently. However, my best guess is that we will require greater crises than we have so far seen (the 2008 crash included) before the populace can be moved towards financial sanity. My prediction - we will require repeated shocks over the better part of the present decade before we come to our senses about money-printing and debt repayment.

The National Inflation Association has the most extensive collection of charts related to issues of money supply, "real" inflation and debt I have so far found. Click here to view dozens of relevant charts on one page.

15 May 2011: Robin Griffiths of Cazenove, according to Eric King, "one of the oldest financial firms on the planet," is widely believed to be the appointed stockbroker to Her Majesty The Queen.

Mr Griffiths expectations? He is calling for silver at $450, and gold at $12,000. (I have commented before, at such levels, the real determinant is the degree of "dollar destruction.") Click here for Eric King's summary.


22 April 2012: The presently linked article by Stephen Bogner is truly definitive on the topic of where the gold price has been and where it is going. Mr. Bogner gives full consideration to the SGS inflation estimates, which I have often cited.

Mr. Bogner believes we are now on the verge of the most significant upward breakout yet in the gold price, and his arguments are compelling. In brief, this is a very important and very recent article. Read "The Gold Megatrend" here.

Note that another year has passed, and we are now looking at a previous inflation-adjusted 1980 high gold price of $9000 per ounce. It seems that the only remaining question is whether we are facing escalating inflation that can be contained by policies similar to those used by Paul Volcker in 1980, or whether we are on the eve of hyperinflation, in which case a $9000 gold price would be meaningless (it would rise much, much higher, but in this case, because of the final destruction of the currency in which it is valued).

20 January 2013: Prediction is a dangerous business in the markets, but it's looking like gold is again heading up strongly in 2013, and with good reason. For your edification, here is a 32-year chart of the gold price, dating back to 1980, the year of the previous intra-day peak of $887.50. 


22 February 2013: Here is a brief summary of several advisors who foresee higher gold prices, and their estimates: 8 People Who Predicted That Gold Would Surge To Over $5,000 Per Ounce

Or... $3200 gold in 1-2 years: Major Top In Stocks & Major Bottom In Gold

14 July 2013: Well, my last few predictions on the price of gold have been dramatically wrong. Despite arguably the strongest fundamentals in history, gold has managed to plummet while essentially all the factors that normally tend to lift the price of gold have been advancing steadily. I've been watching the gold market for a decade now. What have I learned? In brief, when the fundamentals are bullish, the following two rules have so far applied: (1) When the price of gold goes down more, it then goes up more. (2) When the price of gold goes down longer, it then goes up longer. Stay tuned for $5000 gold, and higher. When? Don't ask me. I don't know. But nothing has happened to alter my prediction. 

18 January 2014: Markets, it is said, "do whatever they want." The same can certainly be asserted for the gold market. In fact, bull markets are the most independent, unpredictable and unruly of all markets, as they have "the wind at their back." Gold has certainly proven this since attaining its millennial high of $1924 USD in September 2011, and its recent low of $1179 USD in June 2013 (which was retested only last month). 


It now appears that the recent 2-1/4 year (40%) decline in the gold price has mirrored the 47% plunge in the price of gold between 1974 and 1976 (from $198 to $105.50, during gold's last bull market prior to its current one). 


Great Gold Bust of 1976

Similarly, I think, to most gold bulls, I had believed that gold's 2007-2008 34% pullback (from $1034 to $681) had constituted the long-predicted "primary correction" (a substantial but time-limited price decline that is exhibited by most bull markets). However, as I have just stated, gold, in a bull market, can do anything it wants. Over the past 28 months, it has provided a distinctive opportunity to its most consistent friends (the majority of them in Asia) to buy more at up to 40% lower prices. Hey... good deal for those of us who are still buying (and yes, I am one of those). 


So, where are we now? I have commented many times that short-term predictions are "usually wrong." However, I shall attempt one. There are several good reasons to believe that the primary correction of the present gold bull market has been completed. That doesn't necessarily mean that fireworks lie immediately ahead - a strong advance from here might be "too obvious." But are we again climbing the proverbial wall of worry - and to new highs beyond $1924? I certainly think so. 

I commented in the middle of last year (July 2013) that when the gold price has "gone down more" and "gone down longer," it has consistently "gone up more" and "gone up longer." That would certainly imply prices exceeding the $2000 range in the not-too-distant future - that is, over the next 2-3 years, or possibly less. And a decisive break above the September 2011 high would imply an intermediate top equal in magnitude to the previous decline - that is, in the $2700 range. Interestingly, that price point, in turn, would be about halfway to the $5000-6000 level that we have been discussing here for many years, with the wild card of inflation thrown in to make real numbers unpredictable. 


Well, I've got time to relax, to sit back, and simply to observe - and wait. Why not? The fundamentals for the gold price are stronger now than they have ever been, and physical demand for gold is already at dramatic new highs. I don't know about you, but I can see which way this one is going. 

(Artwork by Brenda Brolly.)
_