22 & 23 December 2014, 12 & 13 January 2015

Collapsing energy prices will be the story of the year for Canada, due to our high costs of production in the oil sands sector. In the US, the primary impact of low oil prices will be on the over-leveraged, capital-intensive and high-turnover shale fracking sector. In Canada, the oil sands operations are much better-funded, but they're not economic at these prices, and we have fracking going on here, too.

But the real Canadian story is that we have so far entirely missed the US real estate correction (due to riding the commodity boom), but the turndown in oil prices is going to hit Canada's real estate market very hard.
While our energy sector is much less leveraged than in the US, our housing sector is clearly vulnerable. Our household debt load has doubled as a percentage of income since 1990.

Canadians are now also borrowing more than Americans, which would not be a good sign at the best of times:

The collapsing oil price is thus emerging as Canada's biggest economic setback in decades (and the natural gas business is no better).

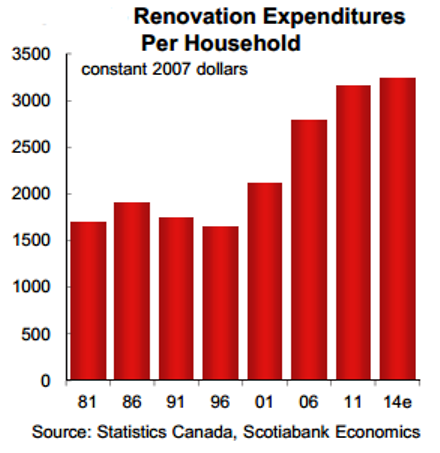
By the way, one statistic really caught my eye. I have been commenting for as long as I can remember that we keep our local construction workers busy full-time without building any new houses. In fact, I have been on the mark. Canada has been involved in a renovation boom for years (see story and chart). Falling energy prices will impact that, too, and it's likely that real estate prices have already peaked, given how fast the rig count is dropping in the oil patch.
Now... will this be the crisis that triggers a resurgence in gold? Well, Mr. al-Naimi just announced that the Saudis don't care if oil falls to $20/barrel. They are obviously wishing to preserve market share, and they are fighting a battle they can win.
Note that the Asians have been playing years ahead of us in stockpiling gold, as a hedge against bad debt and economic volatility. This trend has not reversed since 2011, when the chart below was created.

Despite being embroiled in their own crisis situation, the Russians haven't stopped buying gold either.

In fact, they are selling US dollars to enable their gold purchases (I would, too).

The gold price will be leveraged if there is a credit crunch, and that appears to be what is shaping up. Once again, the crazy Americans have started another boom/bubble with the only real economic and employment growth of the past 7 years having occurred in only 5 shale fracking states. (A map of US shale-energy sites is presented below.)

And of course, everybody will pay for the Federal Reserve's latest experiment in bubble-blowing.

What is the moral of this story? You can't print $4 trillion of funny money and not have consequences. The Fed brought on the so-called Great Recession in 2008 --- arguably a depression, which has so far been masked by moneyprinting and borrowing, but it has not gone away.
The chart below shows that the Federal Reserve has recently accumulated $4 trillion in assets, purchased with printed money, that it cannot sell without creating irreparable market dislocations.

Booms are not the same thing as economic growth. Rather, they are temporary and unsustainable events caused by economic central planners who believe that moneyprinting stimulates the economy. However, moneyprinting always results in malinvestment, which results in transient booms that ALWAYS go bust with real capital loss.

Only saving, combined with capital investment for the long-term, produces growth, whereas stimulating borrowing and debt (the strategy used by economic central planners since 1987) always fails.
As evidence of the current "boom" dynamics, Peter Schiff points out that the number of energy workers in the US has doubled in the past decade.... Let's call this the "stealth bubble," because most of us don't see its direct evidence. Mr. Schiff believes that other bubbles will be unmasked by the collapse of the US energy bubble: Could An Energy Bust Trigger QE4?
In the chart below, we see how decades of Federal Reserve bubble-blowing has decimated US breadwinner jobs.

If you want to know more about how Fed bubble #3 is unfolding (with the usual dire consequences), David Stockman has summarized it here: The Fracturing Energy Bubble Is the New Housing Crash.
Here, we see that Federal reserve intervention has added to jobs only in the least stable and lowest wage sectors.

And for a little more digging into risky energy finance, have a look at John Mauldin's recent review, here (though I disagree with his speculation that we've outgrown our need for jobs --- rather, Fed-induced malinvestment keeps killing them): Oil, Employment, and Growth.
Combined with the above charts, it is evident that the latest boom has led to the creation of only low wage jobs (above) and speculatively-financed carbon energy sector jobs in only 5 states (below).

It's also worth noting that there is presently $173 billion in US energy junk ("high yield") debt presently outstanding, and that it is dragging other debt markets down with it. This is the part of retrenchment with the greatest implications for the economy as a whole. Read more here: U.S. shale junk debt tumbles amid oil crunch.

As would be expected, the Canadian energy sector is under severe pressure as well, as summarized here: Canadian energy firms hit the alarm bells.
The article linked at the start of this post is brief, full of charts, easy to read, and sobering. If I'm right, the energy sector will remain weak until the vulnerable players get taken out of the game. It is bad debt that will eventually force interest rates higher, whether our central planners wish for rates to go that way or not.
On the upside for Canada, which has more mining companies than all other countries in the world combined, the fallout in bad debt from the collapse in the carbon energy sector could be counterbalanced to some degree by a resurgence in the gold mining sector, which will certainly benefit the region where I live (Northwest Ontario).

Keep watching, and look out! The oil price collapse seems quickly to be unmasking Fed bubble #3, as far as I can tell from here.
When do the bubbles and booms stop? When the central planners stop intervening by printing money and "stimulating" borrowing and debt in the absence of viable targets for investment.
Where should the investment be coming from?
Savings, not borrowing.
What should we be investing in, instead of booms and bubbles?
Let the market decide --- without intervention by central planners.
--------------------------------------------------------------------------------------
23 December 2014: Here are some US oil statistics from Wikipedia.
Oil products constitute 7.6% of exports and 14% of imports. The U.S. is the world's largest producer of oil and natural gas. It is the second-largest trading nation in the world as well as the world's second largest manufacturer, representing a fifth of the global manufacturing output.
The United States is the second largest energy consumer in total use. The U.S. ranks seventh in energy consumption per-capita after Canada and a number of other countries. The majority of this energy is derived from fossil fuels: in 2005, it was estimated that 40% of the nation's energy came from petroleum, 23% from coal, and 23% from natural gas. Nuclear power supplied 8.4% and renewable energy supplied 6.8%, which was mainly from hydroelectric dams although other renewables are included.
American dependence on oil imports grew from 24% in 1970 to 65% by the end of 2005. Transportation has the highest consumption rates, accounting for approximately 68.9% of the oil used in the United States in 2006, and 55% of oil use worldwide as documented in the Hirsch report.
In 2013, the United States imported 2,808 million barrels of crude oil, compared to 3,377 million barrels in 2010. While the U.S. is the largest importer of fuel, the Wall Street Journal reported in 2011 that the country was about to become a net fuel exporter for the first time in 62 years. The paper reported expectations that this would continue until 2020. In fact, petroleum was the major export from the country by 2011.
For some Canadian petroleum statistics, please click here.
12-13 January 2015: Arthur Berman offers an insider's view on the economics of shale oil. He clarifies that the real breakeven cost in shale oil is $85, and that a $90 crude oil price is needed to make shale investable. A very strong argument can be made that shale investment "happened too soon" due to central bank intervention and bubble creation. Mr. Berman's article is here.

Mohamed El-Erian explains why "this time is different" here. To be honest, central bank intervention always makes everything different... and worse. Remember: a boom is not growth. It's that simple. Booms are driven by debt and speculation, whereas growth is driven by redeployment of savings and long-term consideration of investment returns under all circumstances.
Jeff Gundlach reiterates the warning here: Gundlach, who correctly predicted government bond yields would plunge in 2014, said on his annual outlook webcast that 35 percent of Standard & Poor's capital expenditures comes from the energy sector and if oil remains around the $45-plus level or drops further, growth in capital expenditures could likely "fall to zero." Gundlach, the co-founder of Los Angeles-based DoubleLine, which oversees $64 billion in assets, noted that "all of the job growth in the (economic) recovery can be attributed to the shale renaissance." He added that if low oil prices remain, the U.S. could see a wave of bankruptcies from some leveraged energy companies.
_